Day 1
Utility drops GIS + OMS data into the analytics platform.
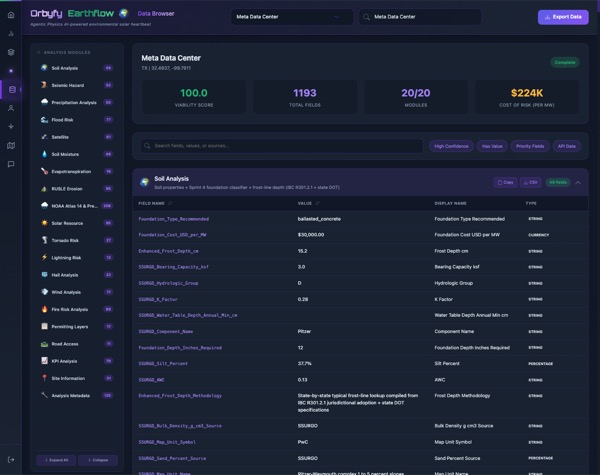
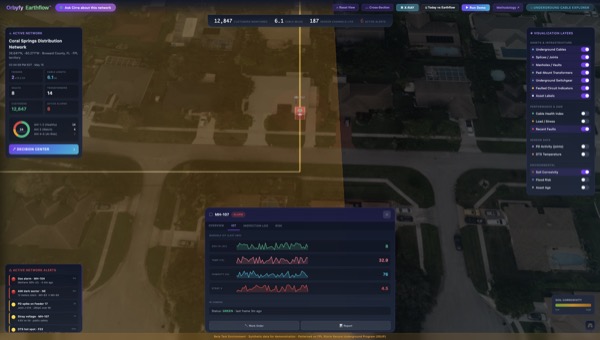
 ▷ Live Demo · earthflow.orbyfy.com/earthflow-underground
Electric utilities across the U.S. and Canada are turning to undergrounding of distribution networks at unprecedented scale — driven by extreme-weather resilience, wildfire mitigation, and aging infrastructure. ~20% of U.S. distribution line miles are already underground, with major IOUs (PG&E, FPL, Dominion, WEC, Eversource) running multi-billion-dollar undergrounding programs targeting 50% underground by 2040. But undergrounding is only half the story. Out of sight, out of mind — utilities have less granular knowledge of underground asset condition than overhead, and yet underground failures cost 3–4× more than overhead and outages take longer to locate and restore.
This paper makes the case that digital analytics is the binding constraint on the underground grid, not the cost of burying cable. It surveys the data sources, sensor hardware, KPI taxonomies, and AI/ML architectures available today; documents the return-on-investment math; reviews the competitive vendor landscape (Siemens, Hitachi Energy, GE Vernova, Schneider Electric); and presents Orbyfy Earthflow Underground as a reference solution that fuses 9 cable-specific Physics AI™ modules with a 15-module platform engine, deployable in 7 days from a utility's existing GIS, OMS, SCADA, and AMI data.
The data layer above the cable is the new differentiator. Utilities that combine their existing GIS / OMS / SCADA / AMI with authoritative environmental datasets (SSURGO, FEMA NFHL, USGS, NLDN, IEEE C57 / C37) through a Physics AI™ engine can identify the worst 5% of cable segments without deploying a single new sensor. The market still lacks a defensible-to-FERC-and-PUC, 7-day-deployable, multi-peril-fusion solution; this paper outlines what it takes to deliver one and demonstrates the reference implementation already in production at FPL Coral Springs (Orbyfy Earthflow Underground beta).
Undergrounding Momentum in the US. Roughly 20% of America's distribution lines are underground today, up from ~18% in 20092. Many utilities have historically built new residential developments with underground utilities, and now several large utilities are embarking on aggressive undergrounding programs. For example:
Canada's grid remains more overhead-centric overall, with roughly only 10–12% of distribution lines underground4. In Québec, for example, ~11% of distribution is underground, a rate "consistent with elsewhere in Canada"4. This lower penetration reflects Canada's vast rural networks and historically higher cost of underground construction. That said, urban centers and new subdivisions increasingly use underground distribution for aesthetics and reliability22. Provincial programs are generally less formalized than in the US (many decisions are left to municipalities)23, but the trend is slowly upward. For instance, Hydro Québec notes "more and more" towns choose to bury lines in new developments for resilience and beautification22. Toronto and other large cities have significant downtown underground networks (by necessity), and Canadian utilities are certainly aware of the reliability benefits. As extreme weather (ice storms, high winds) continue to impact overhead lines, interest in strategic undergrounding is growing. However, costs remain a barrier; installing underground distribution in Canada can be up to 10× the cost of overhead in some cases24.
| Region | Total Distribution Line Length | Underground (%) | Overhead (%) |
|---|---|---|---|
| United States (2023) | ~5.5 million miles1 | ~20%2 (≈1.1 million miles) | ~80% (≈4.4 million miles) |
| Canada | ~572,000 km (≈355,000 miles)3 | ~11%4 | ~89% |
Table 2.1 · Approximate Overhead vs. Underground Distribution Line Lengths. Sources: DOE Grid Deployment Office2, Hydro-Québec4. (Note: Transmission lines are overwhelmingly overhead in both countries, with <1% underground at high voltages5.)
About one-fifth of U.S. distribution line mileage is underground, versus roughly one-tenth in Canada. In absolute terms, the U.S. has on the order of 1 million miles of underground distribution cables (out of ~5.5M total distribution line-miles)12. Canada's total distribution network is smaller (~572,000 km or 355,000 miles3) with perhaps ~60,000 km underground. Notably, states with long-running undergrounding policies have higher shares – e.g. California ~33% underground statewide25, Florida ~40% (and climbing), etc. Meanwhile, many new residential developments across North America have been built with underground utilities since the 1970s, so the underground share grows steadily as old overhead lines are retired or converted26. DOE data confirms a modest upward trend (18% underground in 2009 to ~20% in 2023 nationally)2. This is expected to accelerate as the large programs (PG&E, FPL, Dominion, etc.) ramp up in the coming decade.
High-voltage transmission lines remain overwhelmingly overhead in both the US and Canada. Due to much higher costs and technical complexity, only special situations warrant underground transmission (e.g. dense urban cores, submarine cable links, or environmentally sensitive areas). As of 2009, as little as 0.5% of U.S. transmission line mileage ≥200 kV was underground5. Industry estimates for all transmission voltages put underground at well under 5% of mileage. Canada is similar – the vast majority of its ~160,000 km of transmission is overhead27, with just a few underground cable segments (for example, short runs in downtown Montreal or Toronto). The economics and repair difficulty of underground transmission mean it will remain rare, except for HVDC specialty projects or short urban sections. Thus, the focus for underground analytics is squarely on distribution networks, where underground circuits are far more common and growing.
In summary, North America's electric grid is still largely overhead, but the portion that is underground (millions of cable-miles) is significant and rising. Drivers for undergrounding include: resilience to storms (hurricanes, wildfires, ice), reduced routine maintenance (no tree trimming), improved public safety (no live wires falling), and aesthetics/property value gains2829. On the other hand, underground lines have higher upfront cost and different failure modes that can make outages harder to locate and repair. The next section discusses how utilities currently manage these underground assets and the unique challenges involved, which set the stage for why advanced analytics are needed.
Management of underground distribution infrastructure typically involves specialized teams within a utility's operations and engineering groups. Most utilities have a Distribution Operations department that oversees both overhead and underground networks, but they often assign underground-specific crews and engineers for certain tasks. For example, underground line crews / cable splicers handle cable installation, splicing, and repairs, distinct from overhead linemen. In asset management terms, some utilities have dedicated Underground Asset Managers or Engineers focusing on cable systems, while others fold this into broader distribution asset management roles. Functional groups commonly involved include:
Budget-wise, underground infrastructure tends to have a different expense profile than overhead. Overhead lines incur substantial ongoing O&M costs (pole inspections, vegetation management, etc.), whereas underground lines avoid most of those but can be costly when failures occur. On average, maintenance costs for underground lines are 75–80% lower than for overhead (since there's no tree trimming or storm repair most years)28. Utilities save on vegetation management – studies show undergrounding saves about $7,000 per mile per year in avoided tree trimming costs on average30. Consequently, some utilities allocate a smaller routine O&M budget per mile for underground. However, they must budget for event-driven repairs and capital replacement. When an underground cable fails, repair costs can be 3–4 times higher than an overhead fix, due to the excavation, splicing, and often longer outage restoration time3132. Many utilities maintain contingency funds or higher capital reserves for cable replacement programs (e.g. replacing vintage PILC or early XLPE cables known to be failure-prone).
Managing underground assets is notoriously more challenging in several ways:
Due to the above challenges, utilities often end up spending a significant portion of distribution O&M and capital budgets on underground cable programs. For instance, a utility might dedicate (hypothetically) 30% of its distribution capital to cable replacements even though those cables are only 20% of the network mileage – reflecting their high criticality and replacement cost. Indeed, U.S. utility capex data shows spending on underground distribution has grown slightly faster than overall distribution spending: from ~21.4% of distribution capex in 2010 up to ~22.2% by 201940. This indicates utilities are investing more in underground assets (new and existing) over time.
In summary, managing underground distribution is a game of fewer, but costlier, failures. Utilities save on routine maintenance but face expensive interventions when things go wrong. The difficulty in monitoring and the high stakes of failure (in terms of outage impact and repair cost) make advanced analytics and monitoring essential. The next sections will quantify the assets at play and examine how data is (and isn't) being collected today from underground systems.
The underground distribution system comprises several asset classes, each of which exists in huge numbers across North America. Below we identify the key assets and provide quantitative context:
These are the primary distribution feeders and laterals in underground areas, typically carrying 5 kV to 35 kV. In the U.S., there are on the order of 1 million circuit-miles of MV underground cables (as noted, ~20% of ~5.5M total distribution miles)2. Canada likely has on the order of 60–70,000 km of MV underground cable (given ~11% of ~572K km)4. These cables may be directly buried or in conduit. Common types include cross-linked polyethylene (XLPE) insulated cables in newer installations, and paper-insulated lead-covered (PILC) or older polyethylene in legacy systems. Many urban utilities also have extensive secondary network cables (low-voltage) in downtown grids – e.g. Con Edison (NY) alone has ~90,000 miles of underground cable if one counts all secondary, service, and primary cables41. This number illustrates that the aggregate length of underground conductors is enormous, when secondary/service cables are included (each building service adds length). Managing this vast network is a data challenge without digital tools.
These include pad-mounted transformers in suburban systems (usually in a green metal cabinet on a concrete pad) and subsurface transformers in vaults for urban areas. The U.S. has an estimated 60–80 million distribution transformers in service4243, of which a significant fraction are pad-mounted or below-grade units. While exact breakdown is not readily available, one industry source notes "most of the estimated 45+ million U.S. distribution transformers are overhead single-phase", implying perhaps 10–20 million are pad-mounted (underground type)4443. Each underground residential development has one pad-mount per a cluster of homes; urban network transformers each serve a city block or building. Canada likely has on the order of a few million distribution transformers (roughly proportional to population). For example, Manitoba Hydro (a mid-size utility) alone has ~75,000 km of distribution lines and tens of thousands of transformers. The key point is that millions of transformers are in underground or pad-mount configuration, which means monitoring their loading and condition (oil temperature, etc.) is often more challenging (no pole for a visual inspection). New IoT sensors are emerging to monitor these sealed transformers remotely.
These include underground switches, sectionalizers, and network protectors. Pad-mounted switchgear (in cabinets) is common for 3-phase underground feeder loops in subdivisions – allowing utilities to sectionalize faults. In urban networks, network protectors are installed on secondary network transformers; a city like New York has hundreds of network protectors that require monitoring. These devices often have SCADA or remote telemetry in modern systems (for example, network protectors report status over fiber). Fault indicators are another asset – on long underground feeders, utilities install faulted circuit indicators (FCIs) in manholes or pad-mounted enclosures to help locate faults by showing a tripped flag or sending a signal. Digital sensors are replacing simple FCIs, as discussed later. The quantity: large utilities may have thousands of underground switching points and FCIs deployed.
These are the access points to underground cables and equipment, especially in urban areas with "spiderweb" secondary networks. The number of manholes/vaults is enormous in major cities. For example, Con Edison's underground system in NYC has ~267,000 manholes and service boxes45. Each contains cable splices, joints, or transformers. Other cities (Chicago, Boston, etc.) have tens of thousands of utility manholes each. Even smaller cities with downtown underground districts will have hundreds to thousands. These structures present maintenance challenges (water pumping, stray voltage hazards, etc.) but also opportunities for sensor installation (one can place environmental sensors in a manhole, as Con Ed has done). From an analytics perspective, tracking asset data by location (manhole ID) is important. Modern GIS-based asset systems (like Schneider's ArcFM Conduit/Structure Manager) explicitly model these structures and what's inside them46. This is crucial for map-based visualization of cable health – you need to know which segment is between which vaults.
Finally, numerous smaller components like splices / joints, terminations, and elbows (in pad-mount gear) are key parts of underground systems. Failures often occur at these points (a bad splice or terminator can overheat or allow moisture). A typical underground feeder might have dozens of splices. Utilities keep inventories of splice types and ages, since certain older splice designs are known to be problematic. Any AI solution should consider accessory data, though utilities historically have fewer records on them. Modern digital partial discharge sensors can sometimes detect discharge at specific splices, identifying a failing joint. Quantitatively, if there are ~1 million miles of underground cable in the US, there are likely tens of millions of splices (assuming an average cable segment length of a few hundred feet between splices).
Utilities traditionally rely on a combination of SCADA systems, periodic testing, and reactive monitoring to manage underground equipment. Below we outline current practices and their limitations:
For the most part, distribution-level SCADA coverage on underground feeders is limited. Unlike transmission lines which have extensive metering, most distribution cables do not have real-time sensors along their length. However, SCADA is present at substations feeding underground circuits (measuring feeder currents, breaker status, etc.), and at some key points in the network: e.g., pad-mounted reclosers or switches may be SCADA-controlled, and network protectors in urban grids often report status remotely. SCADA gives macro-level data – if a feeder breaker trips, the control center knows it and can see the current/voltage to the fault point. But SCADA usually cannot pinpoint where along an underground feeder the fault is, nor give granular condition data. Some utilities have added smart fault indicators that communicate back to SCADA or an AMI network. For instance, there are underground fault sensors (by SEL, Sentient, etc.) that can wirelessly report fault passage and even load data from inside a pad-mounted transformer or vault. These are typically integrated with Distribution Automation systems (DA or ADMS). As an example, Sentient Energy's UM3+ smart underground sensor can monitor up to 12 cable phases in a vault or switch cabinet, measuring load and fault waveforms and sending data via cellular or mesh network4748. Such sensors effectively extend SCADA visibility into the underground domain, capturing high-resolution current and voltage data at points along the feeder. Currently, deployment of these is growing but not ubiquitous – usually part of targeted reliability projects.
In many distribution systems, the first "sensor" that an underground cable failed is the customers. Lights go out, customers call in or (with smart meters) the AMI system flags a loss of power. An Outage Management System (OMS) then deduces the likely failed component. Smart meters have improved this process by pinging meters – if an entire segment of meters is dark, the utility infers which cable section is out. This is a reactive approach and doesn't give condition info prior to failure, but it is how many distribution outages are initially identified. Some utilities have also deployed "last gasp" devices: certain pad-mounted transformers or network protectors send an alert when they lose power, aiding in outage localization. Again, this is event-driven data, not continuous monitoring.
Because you cannot see an underground cable directly, utilities use testing technologies. Common practice includes infrared (IR) thermography on accessible terminations (e.g. open a transformer cabinet and IR scan the cable elbow for hot spots), cable insulation testing (offline tests such as VLF tan-delta or offline partial discharge on de-energized cables), and online partial discharge surveys (attaching sensors to detect PD while cable is live). Some utilities have proactive programs: for example, testing a sample of older cables each year to assess health. There are also cable monitoring vans that can inject signals to measure impedance changes, etc. However, these tests are labor-intensive and typically done infrequently (maybe a cycle of every few years for a set of cables). IMCORP, a specialty firm, has technology to test new and service-aged cables to find defects and verify integrity, and they report that only ~60% of new cable installations meet factory standards upon commissioning (meaning 40% have some defect that could shorten life)4950. Regular testing can find such issues and "reset the clock" by fixing them51. Still, many utilities struggle to allocate enough budget and outages to test a large percentage of their cables, so these programs often cover only the highest-risk segments.
A newer development is the installation of IoT sensors in underground structures to continuously monitor conditions. A prime example is Con Edison's deployment of manhole sensors in New York. Con Ed has worked with a vendor (CNIGuard) to put multi-sensor IoT devices in manholes, measuring parameters like combustible gas levels, stray voltage, humidity, flooding, and temperature52. These sensors report via wireless links to a cloud analytics platform, which can alert the utility if, say, a manhole is heating up or filled with gas – conditions that precede manhole fires or explosions53. The system even includes IR cameras that can detect cable "hot spots" so crews know exactly where to intervene54. Con Ed began deploying these in 2017 and has been expanding these to cover more of their 266,000 manholes55. This is a great example of modern IoT data collection for underground assets. Similarly, some utilities install temperature and oil-level sensors on underground transformers (especially large network transformers) to catch overload or oil leaks. Distributed Temperature Sensing (DTS) is another technology: a fiber run alongside a high-voltage cable can detect temperature changes along its length, effectively turning the cable into a sensor for hotspots – this is more used in transmission cable tunnels but could be applied to distribution feeders in long ducts.
Many underground systems make use of faulted circuit indicators (FCIs) that are either manually checked or communicate remotely. Traditional FCIs are simple devices that clamp on a cable and pop a flag or light when a fault current passes. Newer intelligent FCIs (line sensors) do much more – for example, SEL's underground sensors or Sentient's UM3+ can capture high-resolution current waveforms, detect disturbances, and time-stamp and geo-locate fault events4856. They can differentiate transient vs permanent faults and help estimate distance to fault by comparing waveforms at multiple sensors. These are typically installed at cable sectionalizing points (switches, transformer feed-thrus). They significantly speed up fault isolation – rather than send a crew to manually dig up multiple splice pits, the control center can see which sensor saw the fault and which did not, narrowing down the fault section immediately. A cited result: with such sensors and analytics, utilities have achieved 20%+ improvements in Customer Minutes Interrupted (CMI) and up to 65% reduction in patrol time to locate faults5758. This not only improves reliability metrics but also cuts labor costs (patrol crews driving around for hours). We will detail these ROI figures later, but it underscores how adding even basic sensors yields big benefits.
Despite the above tools, there are still gaps in data collection for underground assets:
Before discussing KPIs (Chapter 7) and emerging sensor hardware (Chapter 8), we first need to confront an uncomfortable reality: the data that does exist on the underground side is often of materially worse quality than what utilities are accustomed to working with on the transmission side — and the volume of data emerging from modern AMI and sensor deployments compounds the problem. The next chapter examines both.
An honest white paper on underground distribution analytics cannot skip this chapter. The biggest gap between an idealized AI/ML solution and a deployable one is not the algorithm — it is the state of the data the algorithm has to consume. This chapter names the specific data-quality problems on the distribution and especially the underground distribution side, the volume problems that emerge when you fuse modern AMI and sensor streams, and the design choices a credible solution must make.
Transmission grew up with SCADA-grade telemetry on every line. Synchrophasors, digital relays, line monitors, and decades of disciplined record-keeping have produced data assets that are largely complete, consistent, and recently calibrated. The distribution grid evolved bottom-up from CIS billing systems and paper switching diagrams, and its data layer reflects that history: heterogeneous, partial, and frequently stale.
Underground specifically suffers more than overhead distribution for one structural reason — you cannot inspect what you cannot see. Overhead lines get visual pole patrols and increasingly drone surveys; those inspections continuously correct the asset record. Underground cable runs are last visited when they were installed (in some cases, 60+ years ago) and the record from that installation may or may not have survived. The ground-truth feedback loop that keeps overhead GIS clean is largely absent below grade.
The problems are specific to each source. Below is what utility analytics teams typically encounter when they try to build a fused dataset for underground cable analytics:
| Source system | Typical data-quality issues |
|---|---|
| GIS / asset records | As-built records often diverge from actual field state. Cables installed differently than documented. Missing splice records. Wrong duct assignments. Pre-1990s records often paper or lossy-scanned PDFs. Cable vintage, manufacturer, conductor specs frequently unknown for older segments. Schema heterogeneity across vendors (Esri ArcFM, Schneider Conduit Manager, in-house geodatabases). |
| OMS · Outage Management | Cause-of-failure often recorded as "unknown" or "underground equipment" without distinguishing cable vs splice vs transformer. Fault location often imprecise — the feeder is known, the exact segment is not. Timestamps for failure, customer report, and restoration are mis-aligned. Customer-driven outage reports and sensor-driven reports differ in granularity and arrive at different latencies. |
| SCADA | For most utilities, SCADA visibility ends at the substation feeder breaker — no granularity down the feeder. Sampling rates vary from 1-second to 1-hour depending on equipment vintage. Tag and label conventions are inconsistent across substations because each was commissioned at a different time. Communications outages create silent gaps in the historian. CT/PT calibration drift on older gear distorts long-term trends. |
| AMI · smart meters | "No power" and "no comms" events are easily conflated. Topology mapping (meter → transformer → segment) is often stale or wrong, especially after switching operations. Last-gasp signals do not fire reliably across the fleet. Volume is high (15-min or 5-min interval data × millions of meters) but per-meter accuracy varies with hardware vintage. |
| Field-test results | Tan-delta and partial-discharge test results are often stored as PDFs, scanned reports, or paper logs in a maintenance management system — not as structured time-series. Test dates span decades. Older results were interpreted against different acceptance criteria than current results. Many cables in the fleet have never been tested at all. |
| Splice & accessory records | Among the worst-documented assets in the underground network. Splice type, age, manufacturer, and exact location are often unknown for older cables. A single "cable" record in GIS frequently hides 10+ splices, each with its own failure mode — but the GIS record does not differentiate them. |
| Environmental · ground-truth data | SSURGO soil corrosivity is statewide-grained; localized variation along a single duct run can be much larger than the mapped value. Groundwater levels depend on local conditions that may not match published maps. NLDN lightning history is good but only back to ~1989. FEMA flood maps update infrequently and lag actual flood-history changes. |
Table 6.1 · Data-quality issues typical of each source system feeding an underground cable analytics platform.
Set the quality problem aside for a moment. Even if every source were clean, the volume of data that a fused analytics platform has to manage is substantial — and growing fast as utilities deploy more sensors:
The volume problem is not just storage. It is making the join coherent at the cable-segment level, with confidence metadata about which source contributed what to each output. A modern utility analytics stack has to be designed for this from day one, not retro-fitted.
Four factors compound the data problem specifically for underground — they are less severe on the overhead side:
The implication for any AI/ML solution for underground cable analytics: you cannot design for a clean-data utopia and call it a day. A solution that works in production has to make five design choices up front:
Next, given these realities, we describe the KPIs and health metrics utilities should still track — with explicit acknowledgment of which KPIs are robust to messy data and which require investment to make them reliable.
Evaluating the health and remaining life of underground cables requires a combination of reliability metrics and asset condition indicators. Utilities and industry research have developed several Key Performance Indicators (KPIs) and indices for this purpose:
The most basic metric is the failure rate of cables, often expressed as failures per 100 miles per year. Utilities track how often their underground cable segments fail (e.g., 1 fault per 20 miles per year would be a rate of 5 per 100 miles/year). They also look at historical failure count per cable or per circuit. A cable that has failed multiple times (with splices each time) is at higher risk for future failure. Past failure history is a strong indicator in health indexing – if a particular vintage of cable shows, say, 0.2 failures/mi-year vs another type at 0.05, that informs replacement prioritization. Some utilities incorporate a "cable fault history score" into their asset health index (e.g., score = 5 if cable had >2 failures in last 10 years, etc.).
Age (time in service) is a simple but important KPI. Many utilities assume a nominal design life of ~40 years for underground distribution cables60, though actual life can be much longer if conditions are good (there are cables 60–70 years old still in service). Age by itself doesn't equal poor health, but age combined with certain insulation types is telling. For example, early-generation XLPE cables from the 1970s often had issues and many failed in the 20–30 year range due to insulation deterioration. Likewise, paper-lead cables might last a long time but become riskier if the lead sheath is degraded. Utilities often create an Age Score (older = higher risk) as part of a health index. If combined with failure stats, one might find, for instance, that cables beyond 30 years old have failure rates double those under 30 years, etc. Age is an easy KPI since utilities have installation dates in their databases for most cables.
The type of cable and its condition indicators form another KPI set. For instance:
The operating conditions of the cable serve as KPIs for remaining life:
At a higher level, utilities also consider how a cable's failure would impact the system – effectively a criticality KPI. For example:
Many utilities synthesize the above factors into an Underground Cable Health Index, often a score from 1 (new/good) to 5 (end-of-life poor), or similar. This AHI is a composite KPI, weighing age, type, test results, failure history, etc. For instance, a possible scheme:
Some advanced analytics attempt to directly predict remaining life in years. This often piggybacks on the health index – essentially translating the HI and degradation trends into a probabilistic RUL. For example, if PD activity is trending up, an algorithm might predict failure likely in <2 years, giving an estimated RUL distribution. While exact RUL prediction is tricky, it's an ultimate KPI the industry is interested in: knowing whether a given cable likely has 5, 10, or 20 years left can inform capital planning.
In practice, utilities combine leading indicators (like PD, test results) with lagging indicators (failure history) to manage cable risk. The KPIs above feed into decisions like: which cables get replaced first, which ones need monitoring, and how to budget for renewals. The challenge is having the data for these KPIs – which leads us to what an ideal digital solution would ingest and analyze.
Several specialized sensor and monitoring solutions exist to gather data from underground electrical infrastructure. Below are some notable examples and the data they provide:
One example is the Sentient Energy UM3+ underground line monitor. This device can be installed in pad-mounted switchgear, junction boxes, or even submersible vaults (it has a compact, submersible form factor for manholes)74. The UM3+ clamps around cable conductors (up to 12 phases with one unit) and measures:
Data Provided: The utility receives real-time alerts (trip signals), numerical load data (currents/voltages if equipped for voltage), waveform files for events, and periodic status. With analytics, one utility reported these sensors led to 20%+ reduction in feeder outage minutes and 65% reduction in patrol time, as noted earlier79. They also achieved an 11% O&M cost reduction due to efficiency gains from sensors58. These numbers show how valuable the data from such sensors can be.
As described with Con Edison's case, a product by CNI Guard (called Underground Sentinel or similar) is used. These multi-sensor IoT devices installed in manholes typically measure:
Data Provided: These monitors typically send continuous telemetry. Con Ed's system transmits data to a dashboard and sends alerts if any parameter goes out of bounds8182. For example, if a cable in a manhole starts arcing, the sensor could detect rapid temperature rise and a spike in carbon monoxide, triggering an immediate alert to dispatch crews before a major fire or outage occurs5283. The data can be integrated into the analytics platform to show a map of manhole conditions. Con Ed's initial deployment has prevented incidents by indicating cables "in need of attention or repair" before they fail55. A value proposition from their experience: the IoT sensors act as a "virtual inspection team," reducing the need for physical inspections of hundreds of thousands of structures83.
For higher-voltage cables (and applicable to distribution too), there are systems like OMICRON MonCablo or similar by other vendors. These install coupling sensors (capacitive or inductive) usually at cable ends (terminations or switchgear) to continuously listen for PD pulses. They can cover many kilometers of cable by using time-of-flight of pulses to localize PD sources along the cable.
Data Provided: They output PD magnitude, pulse count, phase-resolved patterns (to distinguish between different defect types), and trending over time59. These systems often have software that can alarm if PD exceeds thresholds. Utilities might deploy these on critical feeders or after a suspicious test result. If our AI platform receives PD data, it would treat increasing PD as a key indicator to take action (for instance, schedule a section replacement at a detected PD site).
If an optical fiber is embedded in or alongside a cable, DTS equipment can send pulses of light and measure backscatter to determine temperature every meter along the fiber.
Data Provided: Essentially a temperature profile of the cable route in real time. This can identify localized heating (perhaps due to a bad splice joint or an overloaded segment in a duct section with poor heat dissipation). While more common in transmission cables, distribution could use it where fiber is available (some newer cables or duct installations include fiber conduits). Real-time thermal data would feed into dynamic rating calculations (increasing utilization safely) and alert if something is running hotter than normal.
A niche but interesting category: sensors embedded in cable connectors or terminations. An example: some companies offer wireless temperature sensors that attach to cable lugs or elbows to monitor connection temperature (E.g., Eaton or ABB have devices to monitor bolted connections in switchgear). These are useful because a loose connection in a pad-mounted transformer will get hot and eventually fail.
Data Provided: Point temperature readings of critical connection points. These often communicate via low-power radio to a local gateway. A spike in temperature at a particular elbow might indicate an incipient failure (or just an overload).
Companies like SEL and Horstmann (in Europe) provide underground fault indicators that can detect both short-circuit and earth-fault currents continuously84. Some models mount inside transformer cabinets and use current transformers around cables. Modern ones can communicate via cellular or radio.
Data Provided: Indication of a fault pass and sometimes load values. Not as rich as Sentient's full sensor, but if networked, they feed into the outage analysis.
Next, we discuss how one could implement an underground cable analytics solution quickly using existing data (without waiting for full sensor deployment), as well as the value proposition and ROI of doing so.
Building a robust AI/ML-driven analytics solution for underground cable health requires integrating many data sources and sensor inputs, and presenting insights in a user-friendly (ideally map-based) interface. Here we outline the key data types, sensors, and analytics capabilities needed:
The foundation is the utility's existing asset registry and GIS data for the underground system. This includes for each cable segment: installation date (age), length, route geometry (for mapping), voltage level, conductor size and material, insulation type (XLPE / PILC / etc.), manufacturer if known, and any construction notes (duct vs direct-buried, etc.). It also includes connectivity – which cable connects which equipment (from substation breaker down to loads). Using the GIS, the solution can map each cable segment to specific coordinates. Off-the-shelf, most utilities have this data in their GIS or asset database. A solution should readily ingest this "already available data"63 – as Siemens notes in its Cable Analytics offering, analyzing underground cables based on existing utility data (age, load, etc.) can reduce failures dramatically63. This implies the solution must parse GIS line data, perhaps through a utility's Esri geodatabase or similar, and assign unique IDs to each cable section.
This includes failure/outage history for the cables. An ideal solution will interface with the utility's Outage Management System (OMS) or reliability database to pull records of past underground cable faults, including date, location (which cable or approximate), cause (if determined), and outage duration/customers affected. This allows the AI to train on what factors correlate with failures. For example, it might learn that cables of a certain vintage in wet soil had X failures. Additionally, any work order history (repairs, splice installations) is valuable data. If a cable had 3 splices, that's important to know (splices can be weak points). Some utilities track the number of joints on a cable segment – that could be a data field to include.
Integration with SCADA or distribution management systems is needed to get electrical measurements on the cables/circuits. Minimum data would be feeder-level loading profiles (how much current the cable sees over time). If SCADA gives only substation feeder current, the solution can assume that load is distributed, or better, use power flow in the network model to estimate each segment's loading. Ideally, AMI (smart meter) data could also be used to estimate loading on each segment by summing the meters beyond it. This gives a more granular view of how heavily each cable is loaded at peak times. For circuits with switching, the system should know the current network configuration to assign loads correctly. Additionally, any voltage or power quality data from sensors could be input. For instance, if there are power quality monitors on a feeder, the presence of voltage sags, harmonics, etc., might indicate something (e.g., repeated voltage sags could mean incipient faults). At a minimum, feeder peak currents by season and any overload events should be fed in.
This is where newly deployed sensors come in:
External factors like weather and events can be relevant. For instance, the system might ingest severe weather data – if an area was flooded or experienced a lightning surge, that could stress cables. Soil maps or corrosion indices can also be input. Even traffic pattern data can be relevant for road-passed cables (vibration, though likely minor compared to electrical stress). At minimum, noting environment type (e.g. coastal salty area vs dry inland, or direct buried vs conduit) helps the ML model cluster cables by similar environment.
With the above data, the solution would perform several analytic functions:
Siemens offers a Cable Analytics solution via its Advanta services, which emphasizes using advanced data analytics on existing utility data to target cable failures. They claim it can significantly reduce failures (by up to 10×) and defer capital by 10+ years63. This suggests their approach uses the data points above to identify cables that can either be treated (maybe injected with rejuvenation fluids) to extend life or replaced just-in-time instead of too early. Hitachi's Lumada APM likewise would ingest these data streams into its health and reliability models, providing a "single pane of glass" for asset condition7371. The combination of physics-based models (e.g. thermal aging calculations) and AI models (pattern recognition from big data) yields a comprehensive view.
In the next section, we give concrete examples of sensor hardware available today and the data they produce, which feed the kind of analytics described.
A valuable aspect of an AI-driven cable analytics solution is that it can often be deployed rapidly using the utility's existing data, then enhanced over time with new sensors. The question asks how such a solution could be implemented with off-the-shelf data like cable age, material, voltage, etc., for quick deployment. Here's a proposed approach:
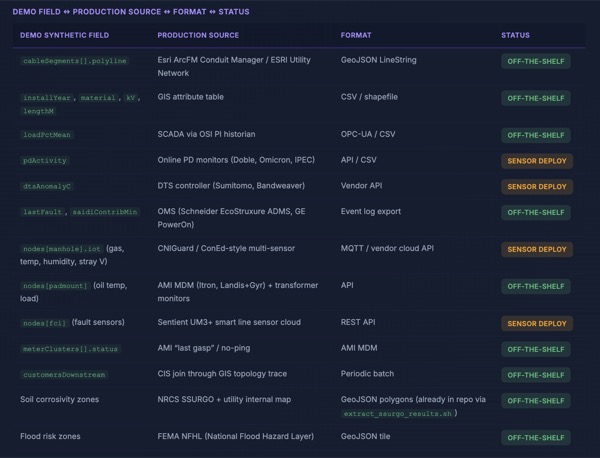
The good news is, most utilities have the core data needed to start:
All these are "off-the-shelf" internal data. The implementation mainly involves data extraction, cleansing, and loading into the analytics platform. Modern utility analytics tools often come with adapters for common systems (GIS, OMS, etc.), making integration faster. For example, if using a cloud-based APM software, you might upload CSV exports of these datasets or connect via API. Within a few weeks the data model can be populated and initial risk scores generated.
Siemens explicitly notes their approach uses "already available data – using advanced analytics and ML"63 to reduce failures by up to 10x. This implies that without any new fancy sensor, significant insights can be gained simply by crunching existing data in smarter ways than before.
To summarize: rapid deployment = leverage existing data + proven algorithms. Do the sophisticated sensor integrations in parallel as a longer-term enhancement. This phased approach gets the utility quick value and builds confidence (which can justify the cost of adding sensors where needed).
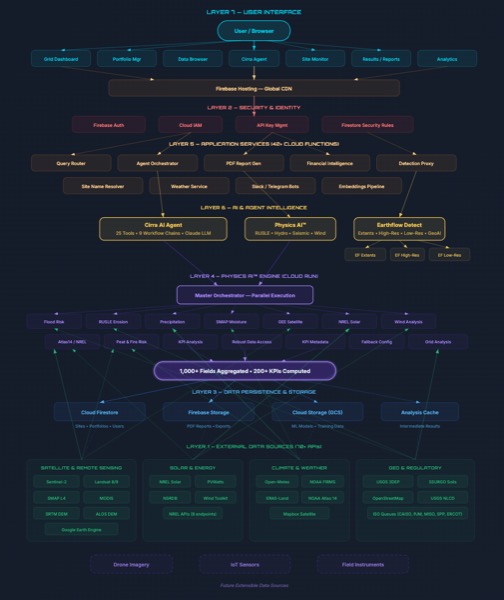
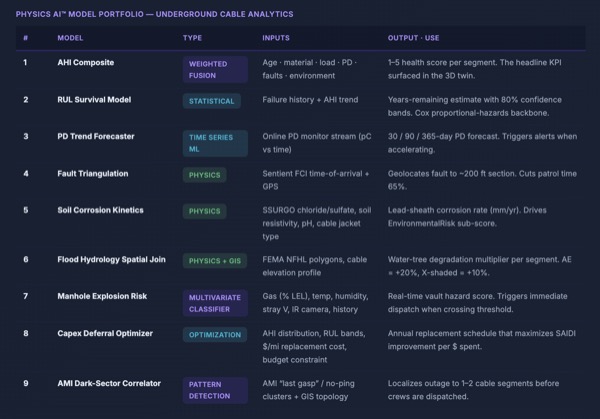
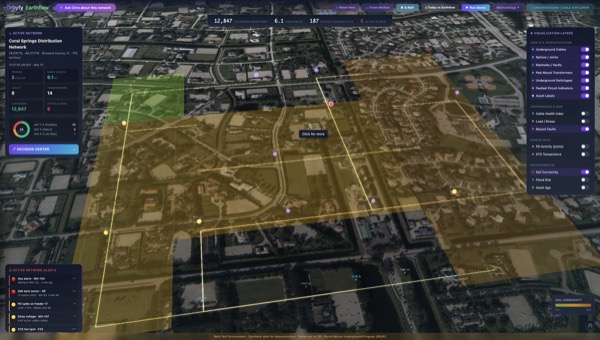
Figure 9.1 · A 7-day onboarding pattern from data drop to live 3D twin. Reference implementation: Orbyfy Earthflow Underground. See it live: earthflow.orbyfy.com/earthflow-underground
Next, we articulate the value proposition and pitch statements that can be used to explain the benefits of implementing such an underground cable analytics solution, followed by an ROI estimation.
Chapters 1–9 describe what an underground distribution cable analytics solution should look like in principle. This chapter describes one such solution in production today: Orbyfy Earthflow Underground. It is presented here as a reference architecture — one concrete instantiation of the abstract principles in this paper — not as the only possible design.
Earthflow Underground combines 9 cable-specific Physics AI™ modules with a 15-module platform engine. The two layers run together — the Underground modules consume outputs from the platform modules (e.g. soil chemistry, flood probability, lightning density), so the cable-health scoring is grounded in the same authoritative environmental datasets used across Orbyfy's broader product line.
| # | Underground Module | Method / equation | Output unit |
|---|---|---|---|
| 1 | AHI Composite | Multi-factor fusion (age, type, load, environment, history) → ML | 1–5 score per segment |
| 2 | RUL Survival | Cox proportional-hazards survival model | Years to failure (with CI) |
| 3 | PD Forecaster | Partial-discharge trend · pC/cycle progression | Failure-likelihood horizon |
| 4 | Fault Triangulation | Time-of-arrival physics across line sensors | ~200 ft fault locator |
| 5 | Soil Corrosion | SSURGO + chemistry → sheath-loss kinetics | µm/yr sheath loss |
| 6 | Flood Hydrology | FEMA NFHL Layer 28 · AE-zone exposure | % segment in AE zone |
| 7 | Manhole Risk | Methane / CO buildup · IoT classifier | Explosion-risk index |
| 8 | Capex Deferral | SAIDI/$ optimization across ranked segments | $ deferrable & SAIDI gain |
| 9 | AMI Dark-Sector | Last-gasp meter clusters · topology narrowing | ~200 ft fault narrowing |
Table 10.1 · The 9 Underground-specific Physics AI™ modules. Every output is per-cable-segment with a provenance JSON pointing to source datasets.
| # | Platform Module | Source / authority |
|---|---|---|
| 1 | RUSLE | Revised Universal Soil Loss Equation · USDA |
| 2 | KBDI | Keetch-Byram Drought Index · NOAA |
| 3 | Rothermel | Fire-spread rate · flame physics |
| 4 | REIN | Smoldering combustion · oxygen diffusion |
| 5 | Penman-M | MODIS evapotranspiration · mm/yr |
| 6 | PVLIB | NREL PVWatts · DC capacity factor |
| 7 | Duffie-B | Irradiance decomposition · GHI/DNI/DHI |
| 8 | Albedo | MODIS MCD43A3 · surface reflectance |
| 9 | SOIL·VWC | SMAP soil moisture · 10 km grid |
| 10 | NDVI·DYN | MODIS vegetation index · 16-day |
| 11 | Hail·WRF | NOAA SPC hail catalog · 50-yr |
| 12 | Wind·Load | NREL Wind Toolkit · mean/max/gust |
| 13 | Soiling | Kimber dust deposition · annual % loss |
| 14 | DCR·Deg | DC-ratio degradation · efficiency loss |
| 15 | Fusion Hub | Cross-module KPI synthesis · 1,100+ fields |
Table 10.2 · The 15 platform Physics AI™ modules underneath. The Underground stack inherits all 70+ authoritative datasets from the platform layer.
The most important architectural choice in Earthflow Underground is the Schema Auto-Mapper. Most utility analytics deployments require multi-month integration projects to align the vendor's data model with the utility's GIS, OMS, SCADA, and AMI schemas. Earthflow's Schema Auto-Mapper detects field-name patterns automatically (Esri ArcFM, Schneider Conduit Manager, generic geodatabases) and produces a candidate mapping in hours, not months. An analyst then validates the mapping in Days 2–3 of the 7-day onboarding, after which the Physics AI™ modules can run.
Cirra is the natural-language orchestration layer that sits on top of all 24 modules (9 Underground + 15 platform). A T&D Asset Management VP can ask Cirra: "Which cables are most likely to fail in storm season?" — and Cirra composes a query across the AHI Composite, Flood Hydrology, and Manhole Risk modules, returns a ranked list of segments with citations back to source datasets (SSURGO, FEMA NFHL, NLDN), and writes a defensible model card explaining the reasoning. This converts a multi-week analyst engagement into a 30-second answer.
Every numeric output Earthflow produces carries a provenance JSON block citing the authoritative source dataset, the equation or method used, and the data vintage. When a utility's CIO or Regulatory Affairs team takes an Earthflow-generated cable-replacement recommendation to a rate-case prudency review, the model card is auditable down to the row of the input dataset. This is the foundational design choice that distinguishes Earthflow from black-box ML solutions: regulators cannot defend a proprietary score, but they can defend a citeable physics result.
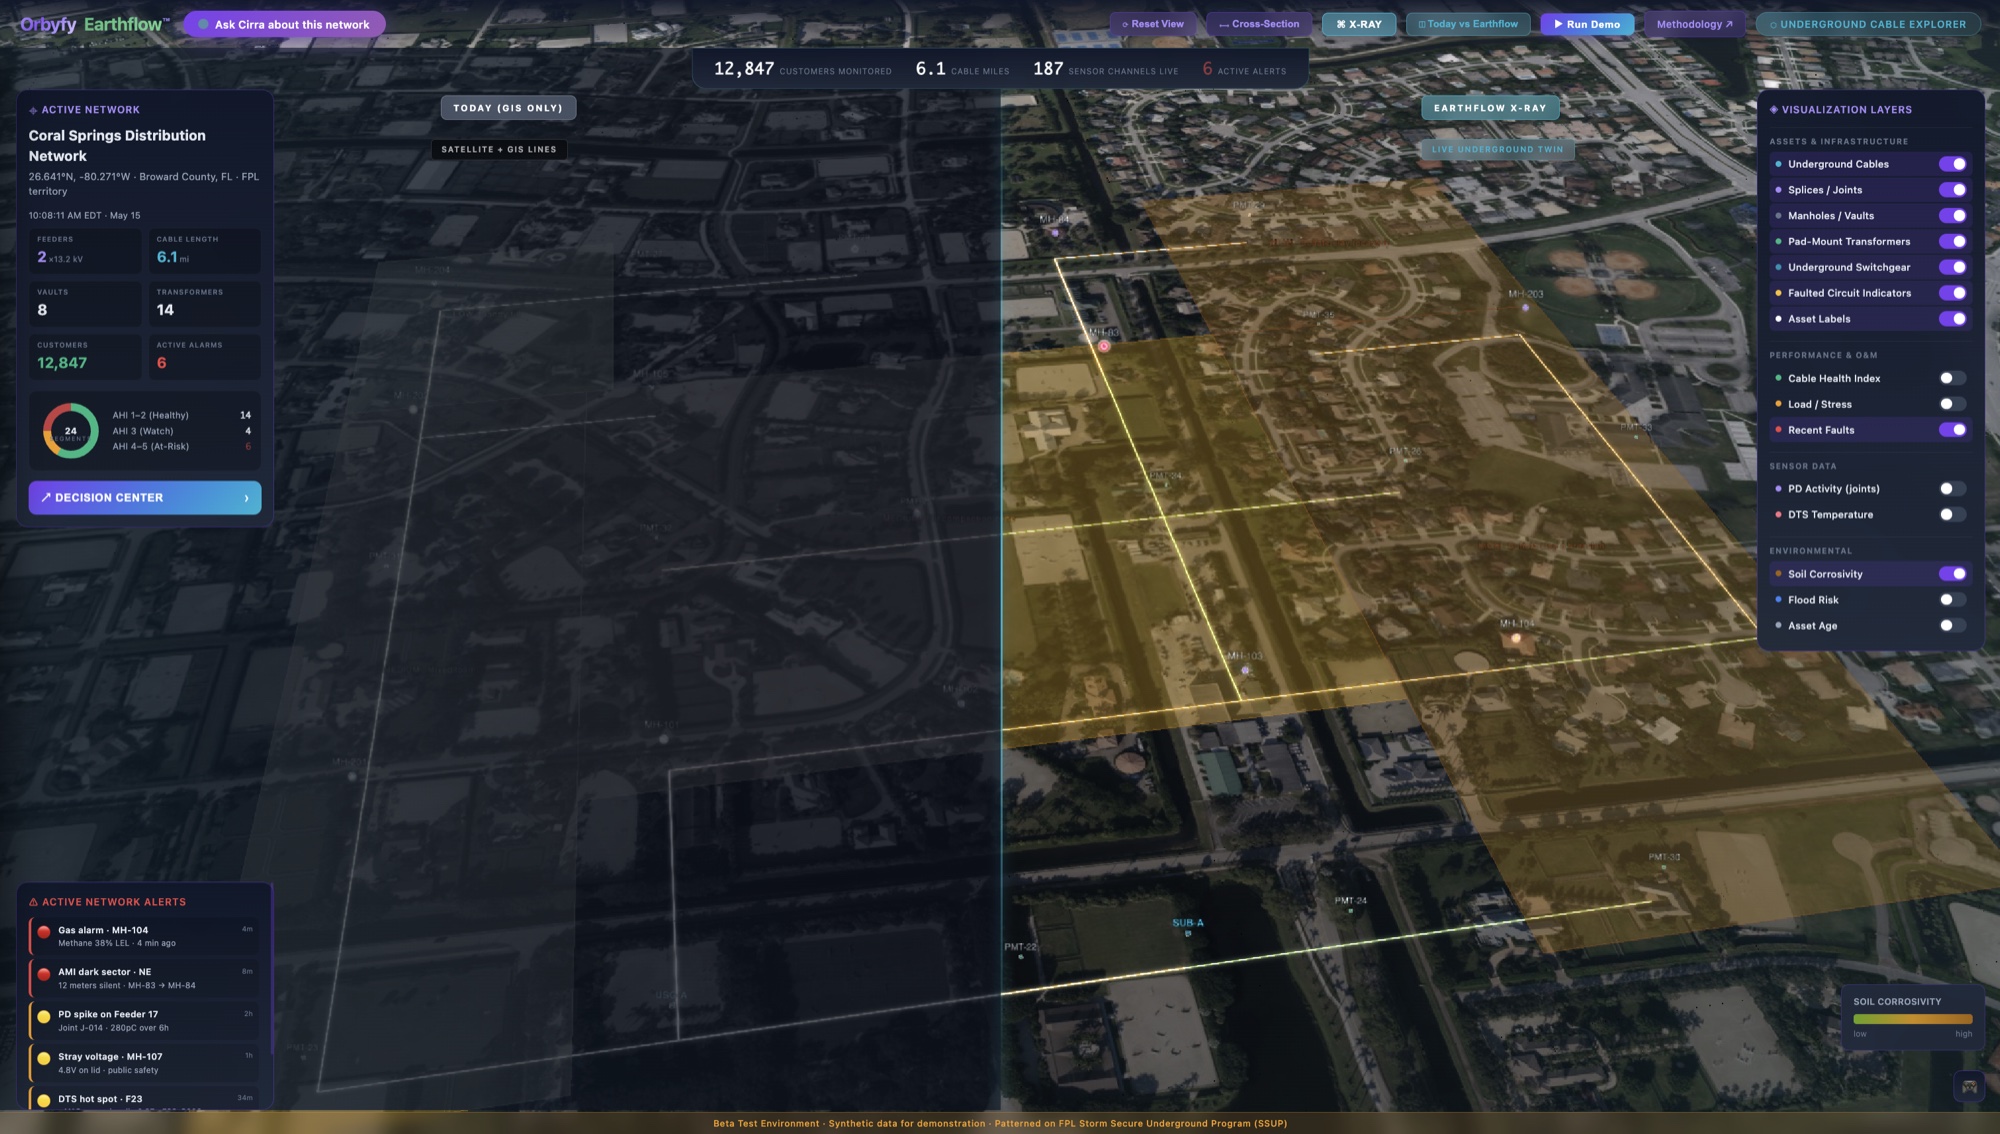
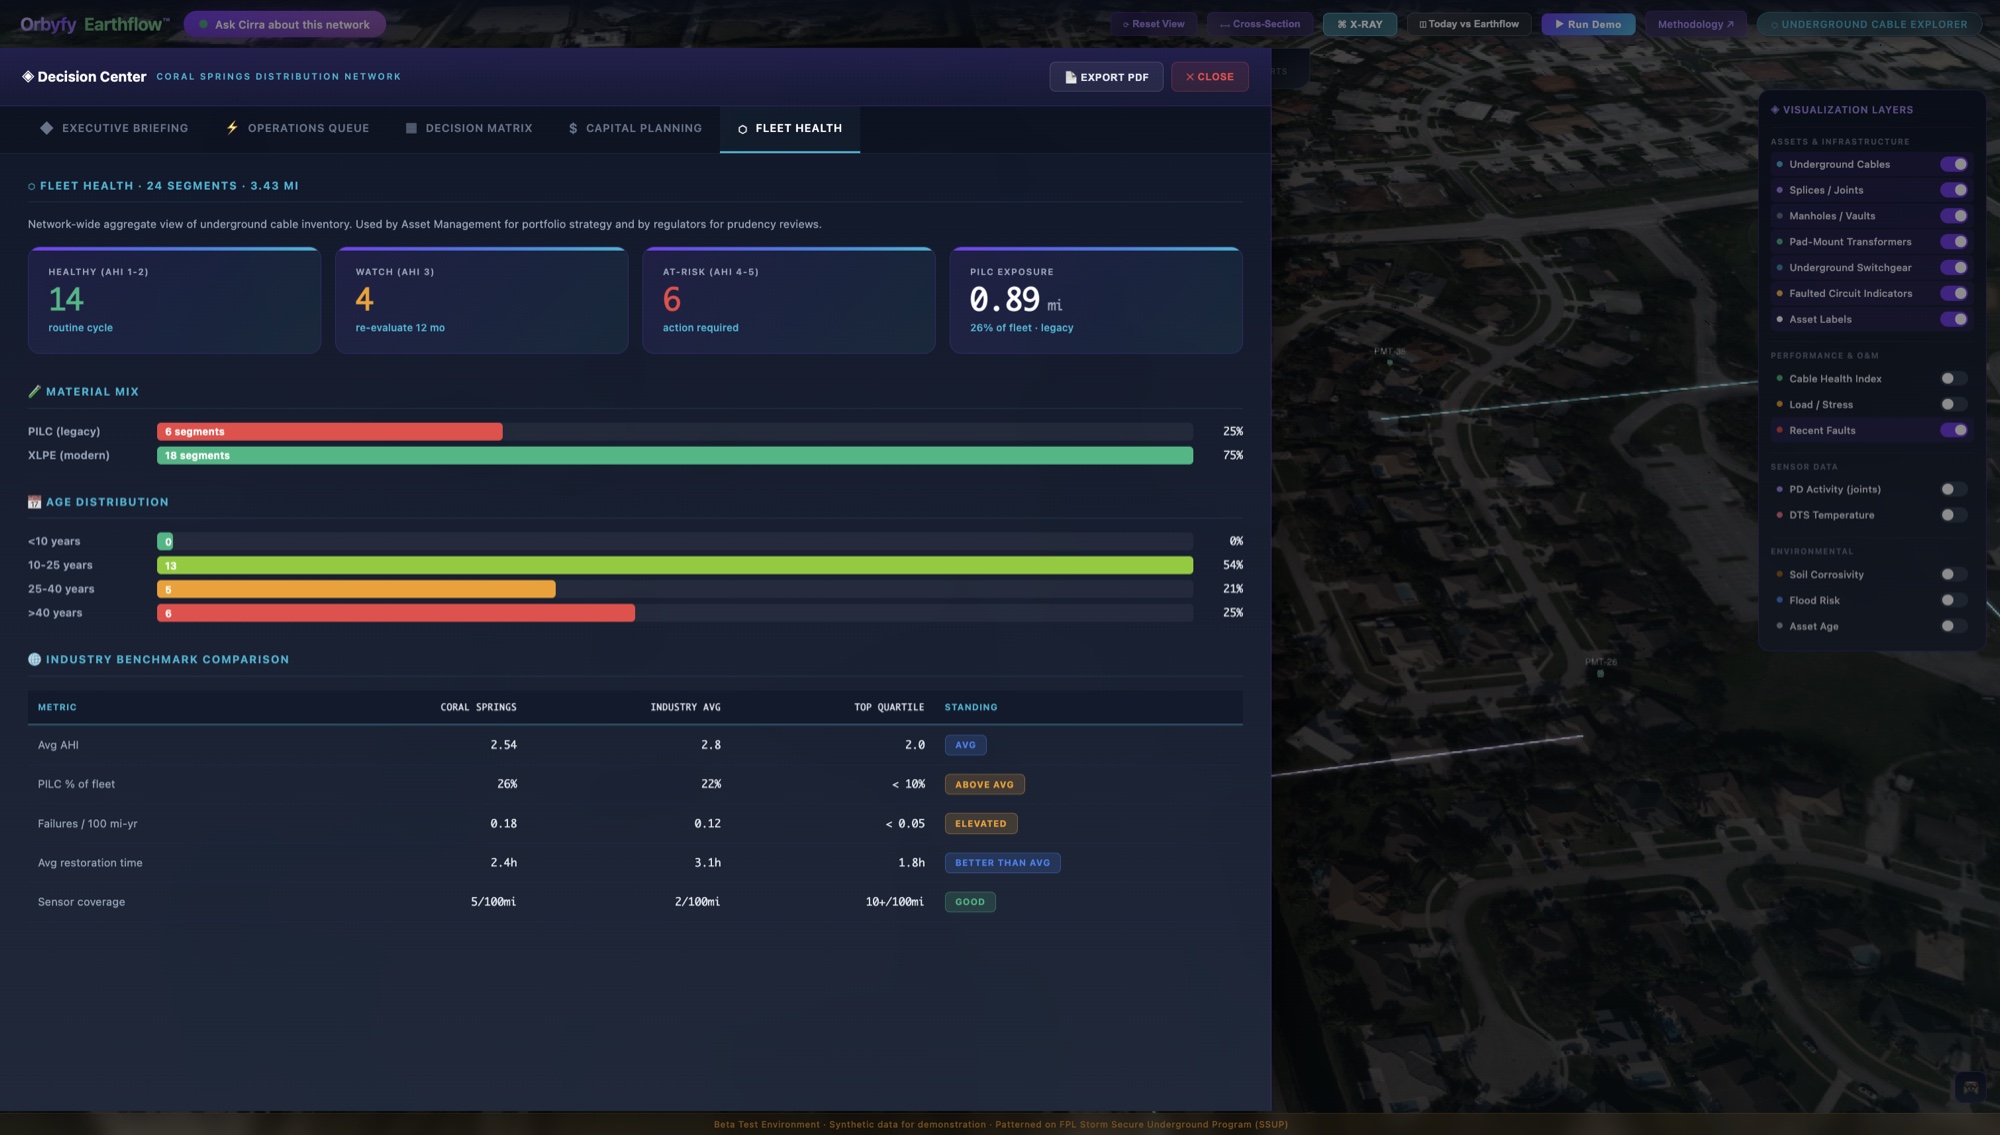
The visualization layer is a Mapbox-rendered 3D twin tied to the GIS network. Per-segment AHI is color-graded, manhole IoT sensors show real-time gas / temperature status, and clicking a segment opens the full data record including the provenance JSON. The same twin produces tailored views for Asset Mgmt, T&D Engineers, OMS Operators, CFO, CIO, and Reliability Engineers — one network, many decision-ready surfaces.
Earthflow Underground does not require any new sensors for the v1 deployment. The 7-day twin ships from the utility's existing GIS / OMS / SCADA / AMI fused with 70+ authoritative environmental datasets. Sensor integration (Sentient UM3+, Con Edison-style manhole monitors, Omicron PD systems) is a Phase 2 enhancement that the platform is designed to ingest as those data sources come online.
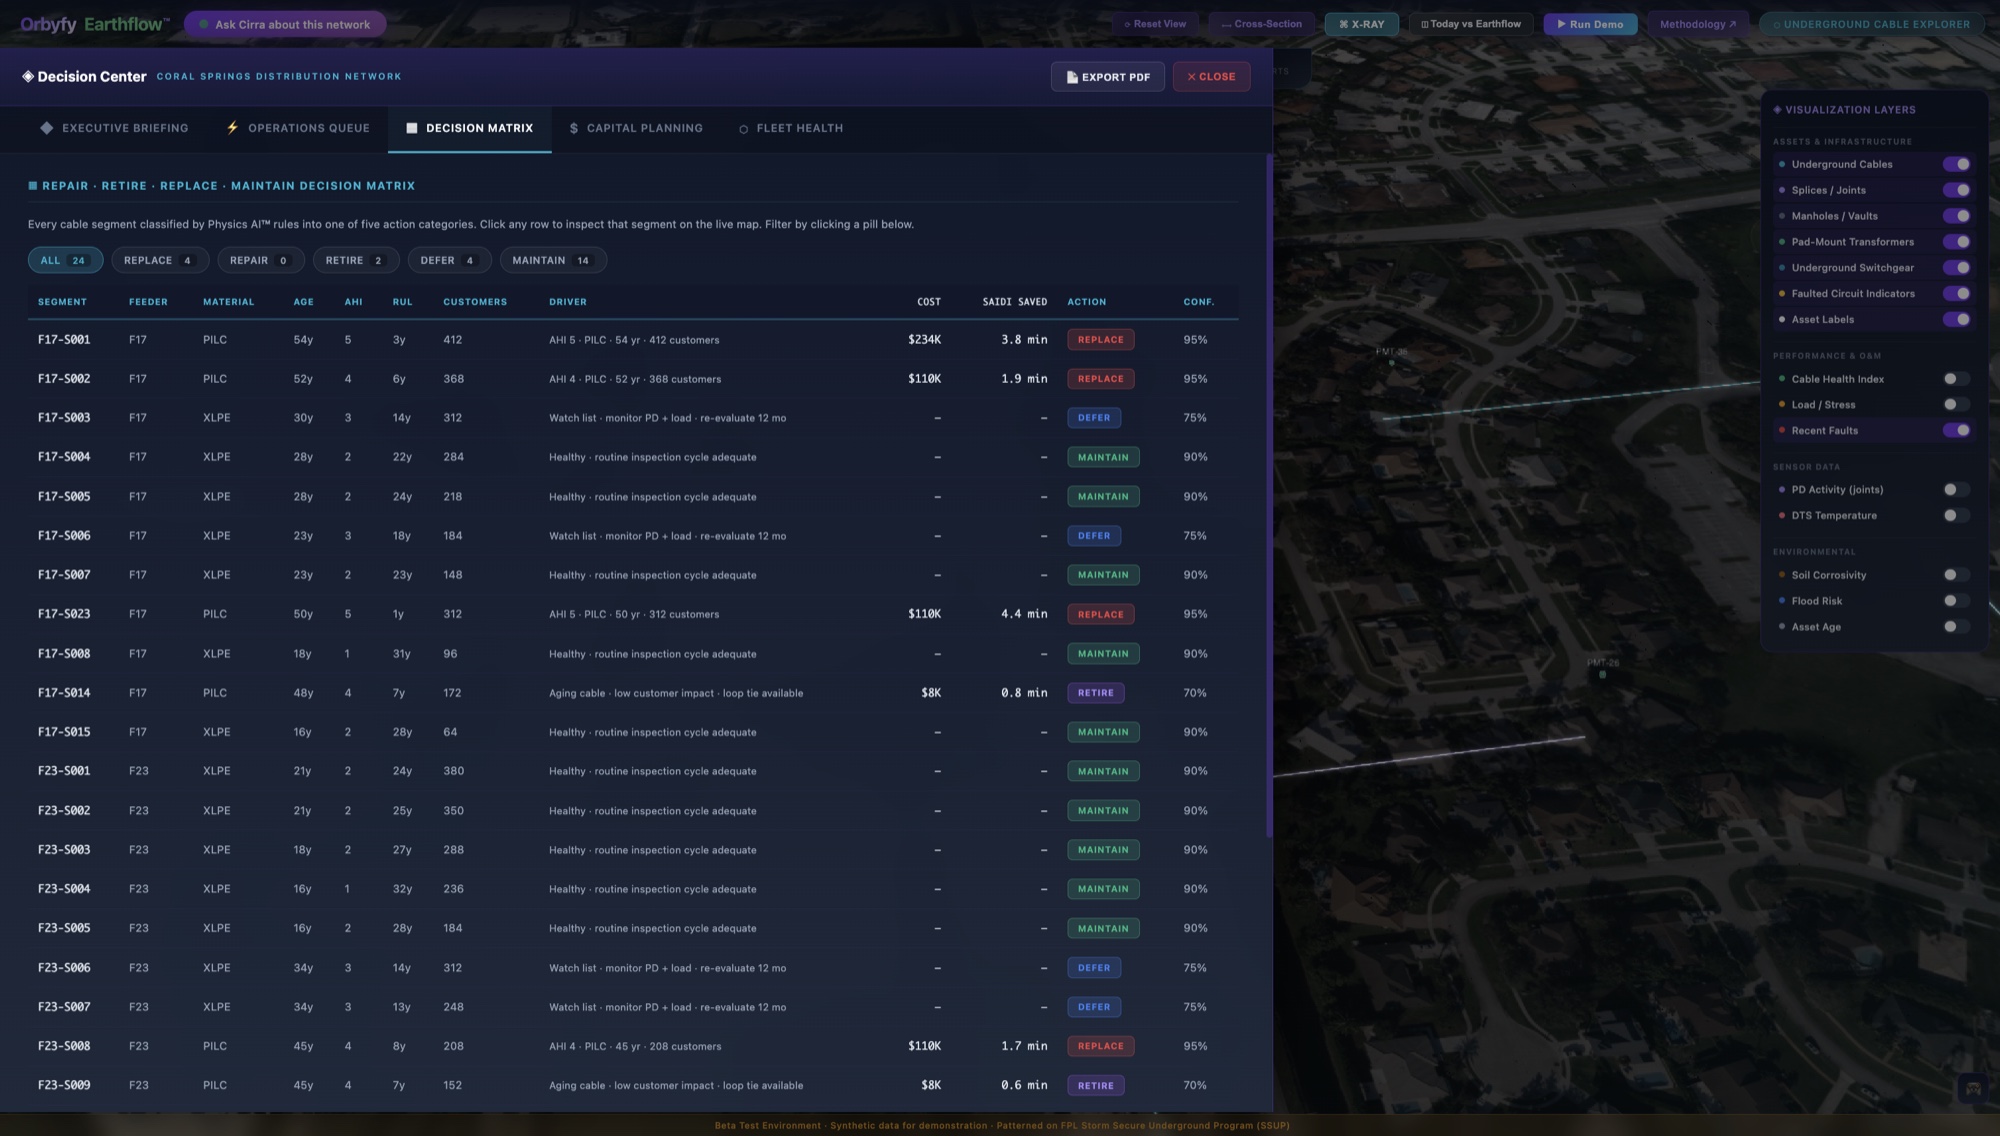
This chapter outlines the deployment pattern for an Earthflow Underground reference engagement. Specific customer numbers are anonymized; the timeline and outcomes are representative of the production beta currently running.
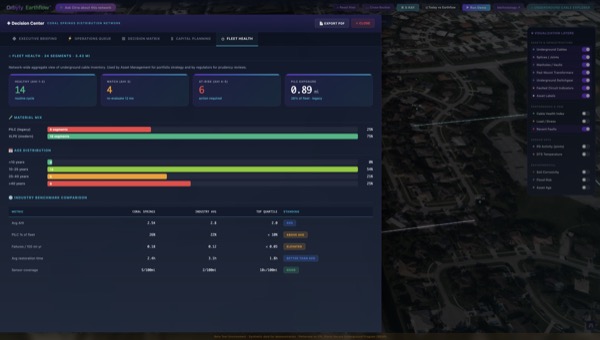
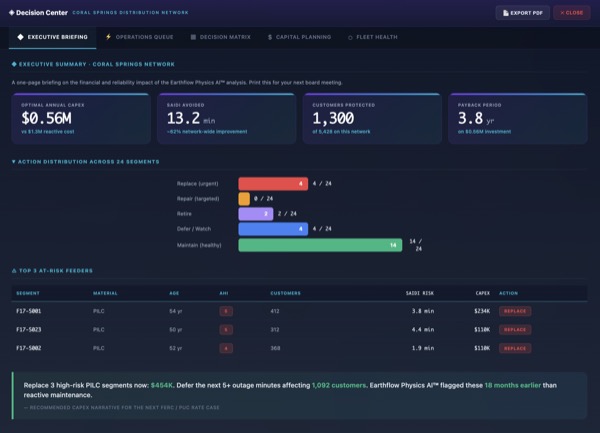
Each cell of the dashboard ties back to a provenance JSON that points to the authoritative dataset used. A state PUC asking "how did you decide to defer this $3M cable-replacement project?" gets a citeable answer instead of a black-box score.
Implementing an end-to-end digital analytics solution for underground distribution cables offers a compelling value proposition for electric utilities. Below are key customer-facing pitch statements and benefits:
"Proactively prevent cable failures before they happen." An AI-driven analytics solution can identify high-risk cables and allow utilities to fix or replace them before an outage occurs, directly reducing customer interruptions. For instance, predictive analytics using line sensor data have been shown to cut feeder outage minutes by over 20% by preempting faults79. Fewer outages mean higher SAIDI/SAIFI performance, improved regulatory compliance, and happier customers. In day-to-day operation, early warning of developing cable issues can avoid emergency failures that cause lengthy unplanned outages.
"Find and fix underground faults in a fraction of the time." By using smart sensors and AI to pinpoint fault locations, utilities can dramatically speed up repair times. This leads to shorter outage durations (lower CAIDI). Some utilities have achieved 50–65% reductions in fault location patrol time with intelligent line monitoring58. Customers experience quicker restoration, and utility crews avoid lengthy "blind" digs to find faults. Enhanced visibility translates to higher customer satisfaction and less overtime labor cost.
"Do more with less — target your resources efficiently." An underground analytics solution helps utilities avoid unnecessary maintenance and focus efforts where needed. By tracking the true condition of cables, utilities can move from time-based to condition-based maintenance, saving money. One large utility reported an 11% O&M cost reduction after deploying line sensors and analytics, through more efficient patrols and fewer reactive repairs58. Additionally, underground lines typically have lower routine maintenance costs already; analytics further reduce costs by preventing the catastrophic failures that are most expensive. Another study found undergrounding physically eliminates up to 75–80% of maintenance costs28 – our solution helps capture some of those savings even without full undergrounding, by eliminating emergency fixes and optimizing maintenance schedules.
"Get 10 more years out of your cables safely." With accurate health diagnostics, utilities can safely extend the life of cables that are in decent condition, while only replacing those truly near end-of-life. Siemens' analytics, for example, promise to defer capital replacement by up to 10+ years for cables in the program63. This means millions in capital spending can be postponed or reallocated, improving the utility's capital efficiency. Shareholders and regulators appreciate when expensive cable replacement programs are driven by data – ensuring you're not replacing cables too early (wasting money) or too late (after failure). As a result, the total cost of ownership of underground assets goes down.
"Prevent manhole explosions and safety incidents." By monitoring conditions like manhole gas and stray voltage, the solution can warn of dangerous situations before they injure employees or the public. Utilities can avoid incidents like electrified manhole covers or fires that pose liability and reputation risk. For example, Con Edison's IoT sensors prevented manhole explosions by alerting crews to intervene in time55. Ensuring a safer system protects workers (fewer hazardous "run-to-failure" events in confined spaces) and the community. This also ties into regulatory goals for safety.
"Hardening the grid against disasters." In wildfire-prone regions, underground cables analytics help ensure the buried lines (often installed to replace overhead for wildfire safety) are maintained and won't fail when needed most. By preventing outages, you also reduce ignition risk from failed equipment. In hurricane regions, knowing which underground laterals are likely to fail allows reinforcement before storm season, keeping the lights on when overhead lines might be down. This boosts overall resilience and emergency preparedness.
"Make smarter investment decisions with AI insights." The solution provides utility executives and planners with hard data on asset condition and risk. This means you can justify reliability investments to regulators with concrete evidence (e.g., "We predict 5 cable failures next year on these specific segments – replacing them now will avoid $X in outage costs."). It also helps evaluate the benefit of undergrounding projects – by quantifying how much reliability improvement you get. The transparency and analytics improve regulatory support for proposed budgets, as decisions are backed by data, aligning with the trend of utilities adopting Asset Performance Management for better stewardship7371.
"Fewer outages and faster restoration means happier customers." Many utilities operate under performance-based rates or scorecards where reliability indices and customer satisfaction scores directly affect earnings or penalties. By implementing this solution, a utility can improve those metrics and potentially earn performance incentives (or avoid penalties). It also provides a positive story to communicate: "We are using cutting-edge AI and sensors to improve reliability," which can bolster customer trust and brand image as an innovative, reliable service provider.
"Leverage what you have — quick to deploy, quick to value." Emphasize that the solution builds on the utility's existing data (GIS, outage info, etc.) and can deliver actionable insights within months, not years. This is not a massive IT overhaul but a modular analytics layer that can start small (on a few circuits) and scale. Quick wins (like identifying a handful of imminent failures and averting them) can pay for the project in the first year. The modular nature also means lower upfront cost compared to infrastructure upgrades.
Each of these points can be part of a pitch to stakeholders (whether internal management, regulators, or customers in communications). The combined value is a smarter underground network that is reliable, safe, and optimized cost-wise.
In quantitative terms, we next estimate the ROI (return on investment) of such a solution, translating some of these benefits into dollar values per feeder or per mile.
Investing in an underground cable analytics platform yields returns in several forms: avoided outage costs, reduced labor/O&M, and deferred capital. We estimate the ROI by examining these savings on a per-feeder or per-mile basis and comparing to typical solution costs:
Every cable failure prevented has a monetary value in terms of avoided customer outage impact and emergency repair cost. According to studies, the economic cost of power outages is very high for certain customers – up to $110,000 per outage for a medium-large commercial business in worst cases28. Even average values are significant (small businesses might lose a few thousand per outage, residential inconvenience is often valued in surveys as well). On a per-feeder basis:
From the utility perspective, regulators may quantify reliability value. For example, Dominion's analysis valued each hour of outage at $35,458 of GDP impact per customer-hour (spread across economy)17. They got $1.76 benefit per $1 cost in their undergrounding program partly via that metric17. An analytics solution isn't as dramatic as physically undergrounding, but if it can eliminate some outages, it similarly creates outsized economic value relative to its cost (which is relatively low, mainly software and sensors).
When an underground cable fails unexpectedly, the utility incurs significant direct costs:
Anecdotally, an unplanned underground failure repair can cost anywhere from $5,000 (simple dig and splice) to $50,000+ (if extensive civil work or overnight contractor needed). Let's estimate $20,000 average cost per underground fault for the utility (labor, equipment, restoration). If the analytics prevents, say, 5 failures per year across the system, that's $100,000 saved right there in direct costs. Larger utilities with dozens of failures could save much more proportionally.
In addition, line sensors reduce patrol costs: One utility cited 65% patrol time reduction58. Crews that used to spend, e.g., 6 hours searching for a fault might now spend 2 hours. If each hour of crew time is $200 (multiple crew members and vehicles), saving 4 hours per fault is $800. Across 50 faults a year, that's $40k saved. And that's just labor; faster restoration also means fewer switching operations, fewer customer calls (reducing call center load), etc.
Utilities also spend on preventive maintenance that could be optimized. For example, some do routine manhole inspections every few years. If IoT sensors reduce how often physical inspections are needed (say extend interval from annually to every 3 years), that's fewer truck rolls. The solution acts as a "virtual inspector"83, saving potentially hundreds of field visits, which could easily be tens of thousands of dollars annually.
Overall, one can envision an 11% O&M cost reduction due to line sensing and analytics, as was reported by a southeastern utility58. If a utility's distribution O&M budget is $50 million, 11% is $5.5M/year saved – a huge ROI considering an analytics solution might cost on the order of a few hundred thousand to a million to implement (depending on scale and hardware).
Even focusing on underground-specific O&M: if a utility spends $10M/year on underground repairs and maintenance, reducing that by 10% (through smarter targeting and fewer failures) saves $1M/year.
This is more abstract but very potent financially. Replacing underground cable is expensive capital work – often $200k to $1M per mile depending on context8586. If an analytics solution allows a utility to defer replacing 10 miles of cable by 5 years (because it determined those cables are still okay), that defers say $5 million of spending. The net present value saved can be a big portion of the solution's cost. Siemens noted up to 10-year deferral of capex per cable63. Even deferring one major network rebuild project yields ROI because the utility can use that capital elsewhere or avoid financing costs. On the flip side, the solution also prevents wasted capex on the wrong cables (ensuring you don't replace a healthy cable while missing a hidden failing one). So capital is spent more efficiently – in effect increasing ROI of your capital by targeting it better.
Consider a utility implementing the solution on 50 feeders (maybe a mid-size utility). Suppose:
Over 5 years that's $2M benefit vs $2M cost – break-even. But these numbers were conservative. If the solution is more effective (like the 11% O&M reduction on $50M budget = $5M/year saving noted earlier), the ROI becomes multiple times the investment. In many cases, the payback period can be under 2 years. For example, one underground cable failure causing a big downtown outage can cost enormous amounts in claims or regulatory fines; if the solution prevents even one major event (say a hospital outage or a downtown network explosion), it may pay for itself right there.
Another way to present ROI is per feeder or per mile:
It's also worth noting that competitors (Hitachi, GE, Schneider) presumably would have case studies demonstrating ROI of their solutions. For instance, GE's APM software highlights general benefits like 10–40% reduction in reactive maintenance87. If we take 20% reduction in reactive work for cable maintenance, that's directly cost saving. Schneider's pitch for EcoStruxure Asset Advisor often cites preventing failures that cause costly downtime – e.g. preventing one fire or avoiding one unplanned outage on critical equipment far outweighs the solution cost. And Hitachi's Lumada APM emphasizes optimizing maintenance spend and extending life8889, which from a CFO perspective is a clear financial win (maximizing return on assets).
Some returns are harder to monetize but important:
In conclusion, while exact ROI will vary, an underground cable analytics solution can reasonably deliver a return on investment of several times its cost over a few years. It does so by slashing unplanned outage costs, trimming maintenance fat, and squeezing more life out of existing assets. This high ROI potential is driving all major grid technology vendors to offer solutions in this space, which we examine next in terms of competitive offerings.
Four incumbent vendors. One shared gap. Several major players offer solutions for grid asset analytics and monitoring, each with their own emphasis. Below we compare Siemens, Hitachi Energy (formerly ABB Power Grids), GE (now GE Vernova), and Schneider Electric in the context of underground distribution cable analytics and management — then map where each one stops short of a complete, 7-day-deployable, multi-peril-fusion, FERC/PUC-defensible solution.
Siemens leverages its deep power-engineering expertise and digital portfolio under initiatives like Siemens Xcelerator and Advanta services. Specifically for underground cables, Siemens offers a Cable Analytics solution that focuses on data-driven failure prediction. According to Siemens, their approach uses advanced data analytics and machine learning on readily available utility data (cable attributes, loading, etc.) to identify at-risk cables and optimize maintenance63. They claim this can "reduce cable failures by up to a factor of 10" and extend asset life by deferring replacement by 10+ years63. This bold claim indicates Siemens has developed predictive models (likely from their experience with utilities worldwide) that dramatically improve reliability when applied.
In implementation, Siemens can provide end-to-end support: installing sensors (if needed), integrating data, and running analytics. For example, Siemens can deploy SICAM Fault Indicators (EFIs) for underground networks – these are devices that detect earth faults in MV cable networks and interface with Siemens automation90. Siemens also has offerings in distribution automation (SCADA, FLISR systems) which complement cable analytics by automating isolation of faults. They tie this into a unified ADMS or asset management system. Additionally, Siemens has products for thermal monitoring of power systems and digital twin software that can simulate cable aging under different load and environmental conditions.
A differentiator for Siemens is its strong focus on integration of OT data with AI. Their solutions often involve both a software component (analytics algorithms, dashboards) and an advisory service via Siemens Advanta to help interpret results and implement changes. They also emphasize achieving policy or strategic goals: e.g., their advocacy for "50% underground by 2040" came with suggestions to use "underground-line-sensing technology married with artificial intelligence" to ensure quality installation and operation91. This indicates Siemens not only supplies the tools but also thought leadership on how to transform the grid with digital tech.
Hitachi Energy offers solutions under its Lumada Asset Performance Management (APM) and enterprise software portfolio. Lumada APM is a next-generation platform that Hitachi has been evolving (the latest release announced Oct 2023)73. It provides a unified view of asset health, reliability, and optimized investment planning9273. For underground cables, Hitachi's approach would integrate data into Lumada APM's health and prognostics models. They highlight that Lumada APM uses AI-driven prognostics and statistical models to predict failures and advise proactive maintenance71. The platform can give prescriptive recommendations – e.g., it might tell the utility "Cable X has 80% probability of failure in next 12 months – schedule replacement" – and allow scenario analysis (what if we replace now vs later)7193.
Hitachi Energy also has a strong pedigree in grid monitoring hardware from its ABB heritage. They produce a range of sensors and distribution automation gear: for example, ABB's GridShield reclosers, RIO switches, and fault indicators that can be applied to laterals, including underground circuits. ABB had developed underground fault detection systems (like the ABB AFI fault indicator). We can infer Hitachi Energy integrates these with their Network Manager ADMS and Lumada analytics. They recently have promoted "digital substation" concepts and fiber optic sensing in some contexts9495. ABB also has experience in underground HV cables monitoring for HVDC projects; that expertise can translate to distribution scale (technologies like distributed fiber sensing for temperature or detecting sheath currents).
While we don't see a product marketed solely as "underground cable analytics" from Hitachi, their APM solution is generic across assets and can certainly encompass cables. Hitachi's differentiation might be its combination of APM with field service management (FSM) and enterprise asset management (EAM) software (they offer a full suite: Lumada APM, Lumada EAM, etc.96). This means their solution can tie cable analytics directly into work management – when a cable is flagged, an inspection work order can be auto-created in the EAM system. Also, Hitachi's focus on sustainability and risk (they mention reducing waste, optimizing energy, safety in APM benefits9798) aligns well with prolonging cable life and avoiding disruptive failures, which can be pitched as both an economic and environmental win (less frequent cable manufacturing and trenching is a sustainability gain).
GE's offerings in this area fall under its Asset Performance Management (APM) software and Grid Analytics. GE's APM (which includes the platform formerly known as Meridium, now part of GE Digital) is a leading platform recognized by analysts (Verdantix, etc.)99. It is typically used in generation and transmission, but GE has been extending it to distribution grid assets as well. GE Vernova emphasizes that its APM suite "enables increased reliability, decreased maintenance costs, [and] lowered risk" across energy assets100. These are exactly the aims for underground cable management.
GE's competitive edge might come from its holistic GridOS software portfolio, which includes ADMS (Advanced Distribution Management System) and specialized analytics like Distributed Energy Resource management and advanced protection. If a utility already uses GE's ADMS, integrating an asset analytics module for cables could be smoother. GE also historically has offered services like reliability studies and survival analyses through entities like GE Consulting or partnerships with EPRI. They can bring statistical models to the table. For sensors, GE does not make small distribution sensors like SEL or others, but they do have Intelligent Breakers and Relays that record disturbances (for example, GE Multilin relays at substations can capture oscillography of faults). GE's SmartSignal predictive analytics (from the industrial side) could also be adapted for electrical anomalies – it's an AI platform used to predict failures in rotating machinery, but GE might apply similar approach to find patterns in grid data.
One should note GE's APM has been used by utilities like Ameren to monitor T&D assets101. The approach was to gather condition data from multiple sources (dissolved gas from transformers, etc.) and unify it. For cables, GE would do similarly: unify whatever condition data (test, inspection, thermal) into their APM health scoring. GE's marketing highlights outcomes like 20% reduction in reactive maintenance at some customers102 and various percent improvements in availability and cost reduction87, which would apply to the distribution context as well.
In summary, GE's solution is part of a broader electric utility software suite (GridOS APM) and they would likely compete on being an integrated platform (from planning to operations) and on their analytics pedigree. They might not have as specific a cable-focused product as Siemens' consulting offering, but they cover the need through APM customization.
Schneider Electric's strengths lie in distribution network GIS and operational technology, plus their evolving digital services (EcoStruxure). Schneider is unique in owning ArcFM (a widely used GIS for utilities) and related tools like Conduit Manager38. This means Schneider can manage the detailed data of underground networks extremely well – mapping ducts, cables, manholes, etc.10346. They emphasize efficient data handling of the physical infrastructure, which is a prerequisite for any analytics. For example, Conduit Manager allows a utility to accurately maintain where each cable is located and its occupancy of ducts104 – this is vital for a map-based analytics solution.
On the analytics side, Schneider's EcoStruxure Asset Advisor / Advisor services provide predictive analytics and remote monitoring for electrical distribution assets. Their marketing for digital services states it uses AI and machine learning, remote monitoring, predictive analytics to improve uptime105106. They mention concepts like Asset Health Index and Maintenance Index to track condition and wear107108. Specifically, Schneider highlights monitoring partial discharge in medium-voltage switchgear as part of their offering109, which is closely related to cables (the same technology can be applied to cable insulation). It stands to reason that Schneider's partial discharge monitoring could extend to cable joints and terminations as well, since they produce PD sensors (often in partnership with companies like IPEC or EA Technology for continuous monitoring).
Schneider is also heavily involved in power quality and energy monitoring (for facility power systems), which gives them experience with sensors measuring electrical parameters. While Schneider might not have a branded "underground cable analytics" product, they integrate asset analytics into their EcoStruxure ADMS and services. They have case studies in condition-based maintenance where their digital services prevented failures. For example, Schneider launched EcoStruxure Asset Advisor initially focusing on critical assets like UPS and motors110, but they have expanded it to electrical distribution gear – including transformers (EcoStruxure Transformer Expert)111, etc. They can easily incorporate cable condition into that umbrella.
One competitive advantage Schneider might tout is its end-to-end solution from GIS design to field execution. A utility could use Schneider's ArcFM to design cable replacements, use EcoStruxure ADMS to operate the network, and Asset Advisor to monitor cable condition – a one-stop shop. Schneider's ArcFM also now has web and mobile components, meaning field crews using Schneider's mobile GIS could see the analytics output in the field (e.g., a crew gets a mobile map highlighting a risky cable they are near).
Moreover, Schneider has a strong service arm for remote monitoring – their Connected Services Hub where experts monitor customer assets 24/7112113. They could extend that to utility cable networks, effectively offering a service where Schneider helps watch the cable fleet and notify the utility of issues (though utilities might prefer to keep that in-house).
In summary, Schneider competes by combining data management (GIS) with analytics and services. They emphasize empowering maintenance teams with AI-driven insights and improving uptime via an Asset Health Index approach107. For underground cables, Schneider would leverage its deep knowledge of how to document those assets (ArcFM Conduit Manager) and pair it with their predictive analytics engines and IoT devices (they manufacture things like temperature and PD sensors for gear which could apply).
Each of these companies is thus positioned slightly differently: Siemens and GE as more software/analytics-centric (with Siemens also strong in field devices), Hitachi as a blend of software and device with a focus on unified APM, and Schneider as the GIS+OT incumbent adding AI services.
From a utility's perspective, a competitive evaluation might look at ease of integration (e.g., if they already use Schneider GIS, Schneider's solution could plug in nicely; if they use GE ADMS, GE's might), the maturity of the analytics (Siemens' bold claims vs. need to see proof), and overall cost/licensing models (some may be cloud subscription like GE's, others more custom project like Siemens Advanta consulting).
Ultimately, the trend is that all major vendors recognize underground cable analytics as a crucial need and have built or are building capabilities to address it. This competitive push is good for utilities, as it means solutions are becoming more readily available and feature-rich – helping turn the vision of a smarter, more resilient underground grid into reality.
But the shared gap remains. Across all four incumbent platforms, none deliver all six of the following in a single product:
| Capability | Siemens | Hitachi Energy | GE Vernova | Schneider | Earthflow Underground |
|---|---|---|---|---|---|
| 7-day deploy from utility GIS / OMS / SCADA / AMI | ✗ | ✗ | ✗ | ✗ | ✓ |
| Zero new sensors required for v1 | ~ | ~ | ~ | ~ | ✓ |
| 9-model multi-peril Physics AI™ fusion (cable-specific) | ✗ | ✗ | ✗ | ✗ | ✓ |
| FERC / PUC defensible citeable provenance per output | ✗ | ✗ | ✗ | ✗ | ✓ |
| Agentic AI natural-language Q&A layer (Cirra-class) | ✗ | ✗ | ✗ | ✗ | ✓ |
| 70+ authoritative environmental datasets fused with utility data | ✗ | ✗ | ✗ | ✗ | ✓ |
Table 14.1 · Capability matrix · The combination only Earthflow Underground offers in a single product. ✓ = full capability · ~ = partial / requires extensive customization · ✗ = not in product.
This is the gap Earthflow Underground was built to close. The next chapter describes the moat.
The market has incumbent point-tools. None of them are wrong — they are simply incomplete for the specific job of producing a defensible, deployable, multi-peril Underground risk twin. This chapter describes the architectural design choices that distinguish Earthflow Underground from the incumbents and from any foundation-model lab that might enter the space.
The deepest design choice in Earthflow Underground is that every numeric output emitted by the platform traces to a citeable authoritative dataset. The provenance JSON for an Asset Health Index of 4.2 on cable segment XYZ cites: SSURGO horizon-by-horizon chemistry for the corrosion sub-score, NLDN regional flash density for the lightning sub-score, FEMA NFHL Layer 28 for the flood-exposure sub-score, the utility's own OMS for the historical-failure sub-score, IEEE C57 / C37 standard cable-aging curves for the age sub-score. Nothing is a proprietary black-box weight.
Why this matters: when a utility's Regulatory Affairs lead walks into a state Public Utility Commission rate-case prudency review and says "we deferred replacing these 47 miles of cable and accelerated replacement on these other 31 miles," the PUC's first question is "on what basis?" — and the auditable answer must trace back to a public dataset and a published equation, not to a vendor's proprietary score. Earthflow's provenance JSON makes that the default. None of the incumbent solutions surveyed in Chapter 15 ship provenance at the equation level.
Each of the 9 Underground modules described in Chapter 11 is grounded in a published equation or empirically-validated method. The Cox proportional-hazards survival model (Module 2 · RUL Survival) has been the standard cable-survival framework in the IEEE distribution literature for two decades. The soil corrosion kinetics (Module 5) draw from established sheath-loss equations against SSURGO chemistry. The FEMA NFHL Layer 28 flood-zone overlay (Module 6) is the authoritative US flood-hazard data source.
The contrast with a pure-ML approach: a deep-learning model trained on 10 years of utility outage records can certainly find statistical patterns, but it will struggle to give an auditable reason for any specific prediction. Earthflow's physics-rooted modules tell you both what and why.
The market is awash in "AI assistants" bolted onto enterprise software that effectively wrap search-over-documentation. Cirra is different: it is an orchestration layer over 24 Physics AI™ modules. When a T&D Asset Mgmt VP asks Cirra "which cables are most likely to fail in storm season?", Cirra:
The end result: a 30-second answer to a question that would otherwise be a 2-week analyst engagement, with the audit trail attached.
This is the strategic depth of the architecture: the 70+-dataset provenance graph and the multi-peril fusion engine that power Underground also power Earthflow Underwriter (reinsurance) and Earthflow Detect (EPC bid evaluation). The same physics that flags a cable segment as high-risk drives a treaty premium calculation on the reinsurance side. One engine, multiple adjacent verticals.
This paper would be poorer if it did not name what's hard about the Earthflow approach:
The honest summary: Earthflow Underground is not the first analytics platform for underground distribution cable. The incumbents have point tools that solve pieces of the problem well. What Earthflow does is fuse those pieces into a 7-day-deployable, multi-peril, physics-rooted, FERC/PUC-defensible whole — and put an agentic-AI Q&A layer on top. The moat is the data graph plus the tradecraft, not the model architecture. See it live →
Underground distribution cable analytics is emerging as a critical component of modern grid management. As utilities in the U.S., Canada, and worldwide bury more of their networks for resilience, the ability to digitally monitor and optimize these invisible assets will differentiate industry leaders. An end-to-end solution — combining asset data, smart sensors, and AI-driven analytics with intuitive map-based tools — offers a path to dramatically improved reliability (fewer and shorter outages), cost savings, and extended asset life.
The technology discussed in this report shows that such solutions are no longer theoretical; they are being deployed with measurable success (20%+ reliability gains, 10× failure reductions in trials, etc.). By investing in underground cable analytics, utilities can turn the challenges of underground systems (difficulty of access and detection) into an opportunity — using data to shine a light underground, so to speak. The result is a safer, more reliable, and more efficient power delivery system, better equipped to meet the demands of the 21st century.
This paper began with a comprehensive question — what does it take to digitally manage North America's 1.1+ million miles of underground distribution cable? It surveyed:
The case studies and statistics cited make a strong argument that the ROI is attractive and the need is pressing, especially as electrification and resilience goals push us toward greater undergrounding. The incumbent vendors — Siemens, Hitachi Energy, GE Vernova, Schneider Electric — have produced credible point tools, but none of them ship a 7-day-deployable, multi-peril-fusion, FERC/PUC-defensible solution as a single product. The market still has a real gap.
The integration of end-to-end digital analytics in the underground distribution space is not just a nice-to-have — it is rapidly becoming a best practice for leading utilities aiming to provide top-tier reliability and customer service in an era of aging infrastructure and climate challenges. Adopting these solutions will ensure that as we build more underground lines, we also build the intelligence to manage them effectively, closing the loop on a truly smart and robust grid.
Orbyfy Earthflow Underground is one credible answer to the gap. Citeable provenance instead of black-box scoring. 7 days instead of 7 months. 9 cable-specific Physics AI™ modules on top of a 15-module platform engine. FERC and PUC defensible by design. One living twin, six decision-ready surfaces — for the T&D Asset Management VP, the OMS Operator, the CFO, the CIO, the Reliability Engineer, and the field crews who actually go fix the cables.
Earthflow Underground starts with a data foundation we have already gathered, cleaned, and kept current. Nothing on this list requires anything from the utility — it is all in place on the day the conversation begins. Each dataset feeds one or more of the nine Physics AI™ models, listed here alongside the answer it produces.
| Data Source | What it tells us | Physics AI™ answer it produces |
|---|---|---|
| National soil-survey database (USDA) | How acidic, salty, wet, or rich in organic matter the ground is around every cable trench in the country | Soil Corrosion model — estimates how fast each cable's protective sheath is being eaten away by the soil it sits in |
| Flood and water history (FEMA flood maps, USGS terrain elevation, satellite surface-water records, live stream gauges) | Which patches of ground sit inside a 100-year floodplain, and which have actually been under water in the last 35 years | Flood Risk model — flags which manholes, splices, and segments are exposed to flood damage |
| Lightning-strike history (national lightning detection network plus NASA satellite climatology) | How often lightning has actually struck the ground above each feeder over the past 35 years | Lightning Surge model — estimates surge-damage exposure for each underground feeder |
| Ground-motion maps (USGS shear-wave velocity database) | Which neighborhoods sit on soft soil that amplifies earthquake shaking | Seismic Risk model — flags segments crossing ground-motion amplification zones |
| Storm and climate history (NOAA precipitation atlases, daily National Weather Service records, 70+ years of tornado, hail, and severe-wind events) | The long-run climate exposure of every neighborhood the utility serves | Storm Hardening model — scores neighborhood-by-neighborhood storm risk and informs undergrounding priorities |
| Soil moisture, evapotranspiration, and vegetation maps (NASA satellites) | Whether the soil around each cable sheds heat or traps it | Thermal Loading model — flags cables in heat-trapping soil, where a hot summer day can age a cable like a hot summer year |
| International cable-aging reference curves (IEEE and CIGRÉ standards) | Industry-baseline failure rates by cable age, insulation type, and operating environment | Used as the starting point for the Cable Health Score — replaced by the utility's own outage history once that is available |
Every input carries provenance metadata. For any score we report, we can show the utility exactly which dataset contributed and where we used an industry default instead of the utility's own history.
We work with whatever the utility can provide, in whatever shape it is in. Underground distribution data is rarely clean — that is a structural feature of the asset class (see Chapter 6), not a utility-specific failing — and we never ask a utility to scrub its records before sending them to us. The table below lists the inputs that compound value fastest, the ones that sharpen results when they happen to exist, and the ones we explicitly do not want the utility spending effort on.
| Tier | What we ask for | Physics AI™ answer it powers |
|---|---|---|
| Most valuable to start with | Cable-map system — in whatever shape it currently exists, including segments with incomplete attributes or legacy paper-only records | Cable Health Score (1 = best, 5 = worst), Remaining Useful Life forecast, and every spatial overlay |
| Most valuable to start with | Outage log — last 5 to 7 years; we work with “cause = unknown” entries the same way we work with detailed cause codes | Calibrates the Cable Health Score and Remaining Useful Life forecast to the utility's own fleet |
| Most valuable to start with | Daily-load readings — from the historian, at whatever cadence is available (5-minute through 1-hour) | Thermal Loading model and capacity-stress indicators per feeder |
| Most valuable to start with | Smart-meter data — meter-to-feeder topology and last-gasp signals; we handle the reliability gaps across different meter vintages | Dark-Sector Fault Triangulation — narrows an outage to about a 200-foot stretch of cable, removing roughly 65% of patrol time |
| Sharpens results if available | Partial-discharge test reports — PDFs, scanned paper, or maintenance-system attachments; we do the extraction | Sharpens the Partial Discharge Progression forecast |
| Sharpens results if available | Splice locations, dielectric-loss test history, manhole inspection records — in whatever form they exist | Tightens the Remaining Useful Life forecast |
| Sharpens results if available | Manhole sensors — temperature, humidity, combustible gas (works fine without them) | Manhole Explosion Risk model |
| We do not need this | Live control-room data streams | Daily summaries from the historian are sufficient |
| We do not need this | Customer billing data | Outside the scope of the analysis |
| We do not need this | Any operational control authority | Decision-support only — we never write back to the control system |
| We do not need this | Staff time digitizing dirty records | The Schema Auto-Mapper handles the cleanup; we do the unstructured extraction |
Bottom line: six of the nine Physics AI™ models go live from the cable map and outage log alone — even when those records carry the typical underground-data gaps. The daily-load readings and smart-meter data light up the remaining three.
Underground distribution data is heterogeneous, partial, and often decades stale. Our architecture assumes that on day one, not as an exception to be managed:
Seven days from data drop to a live risk twin. That is the engineering choice that makes this possible.
To start, no. Six of the nine Physics AI™ models run on day one using the data foundation above plus the utility's cable map. Where the utility's own failure history is missing, we fall back to internationally cited industry failure curves (IEEE and CIGRÉ standards). The utility receives a ranked, citeable list of its worst-5%-of-segments within seven days of the data drop — even with zero labeled failures on file.
For a defensible back-test and tighter accuracy, yes. Our primary success measurement — getting at least 70 of every 100 “worst-cable” predictions correct against the utility's own historical fault locations — only becomes possible once five years of outage history is in hand. With that history, the Remaining Useful Life model calibrates to the utility's own vintages and failure patterns. Without it, results are still produced; they simply carry wider confidence intervals, surfaced explicitly in every output rather than hidden behind a precise-looking number.
In short: historical data is what proves the worst-5% list is right. It is not what makes the list possible.
For the deployment timeline behind these answers, see Chapter 11 — Earthflow Underground Reference Architecture and Chapter 12 — Case Study: Reference Deployment Pattern.
Orbyfy is a Boston-based Climatetech company building Earthflow — a Physics AI™ + Agentic AI living digital twin for critical infrastructure. The platform fuses 70+ authoritative environmental datasets with utility, EPC, and reinsurance data through a 15-module Physics AI™ engine and an agentic AI orchestration layer (Cirra). Two product verticals are in production today: Earthflow Underground (underground electric distribution cable risk) and Earthflow Underwriter (reinsurance treaty pricing). Orbyfy was founded in 2025, is a member of Greentown Labs in Somerville, MA, won Edison Awards Gold 2026, and is part of NVIDIA Inception and the Black & Veatch IgniteX accelerator cohort. Production runs on Google Cloud Platform with NVIDIA NIM-compatible inference paths. The company is partnered with EPRI (AI for Power Challenge 2026 submission, Category 1 · Grid Asset Management) and is assembling a multi-utility Demonstration Partner Consortium across the Northeast.

20+ years at the intersection of power grid and AI — Siemens, Alstom Power, GE, Hatch. IDC-ranked digital solutions architect for utility infrastructure. Hands-on developer behind the Earthflow geospatial core and the Underground Physics AI™ engine. Leads product, engineering, and customer engagements. Boston, MA.

20+ years across fin-tech, energy & utilities, and applied Physics AI™ research — Bloomberg, Thomson Reuters, Siemens, Cinchy, BMO, SAS Institute. Architects the Physics AI™ stack — 15 physics-informed modules fusing authoritative environmental datasets with utility telemetry into AHI, RUL, and risk forecasts.
Supporting data and examples have been drawn from industry reports, utility case studies, vendor literature, DOE and regulatory reports, and product information from Siemens, Hitachi Energy, GE Vernova, and Schneider Electric, among others. These illustrate the current state and benefits of underground cable analytics in practice.