A Physics AI living digital twin for primary medium-voltage underground distribution.
Every segment scored. Every score auditable back to the inputs behind it — measured or imputed. Earthflow Underground is a solution for Underground Cable Health.
A health score on every segment, with remaining useful life and a confidence band.
Where headroom runs out — before the new load arrives to find it.
Rank segments for partial discharge and tan δ, instead of testing on the calendar.
Which corridors buy the most risk reduction per mile of spend.
A virtual sensor on every buried cable segment — updated every month.
You cannot put a sensor on miles and miles of buried cable. You can compute cable condition — for every segment, every month.
A soft sensor on every buried segment — the first continuous record for condition, capacity, and environment, refreshed monthly for every mile.
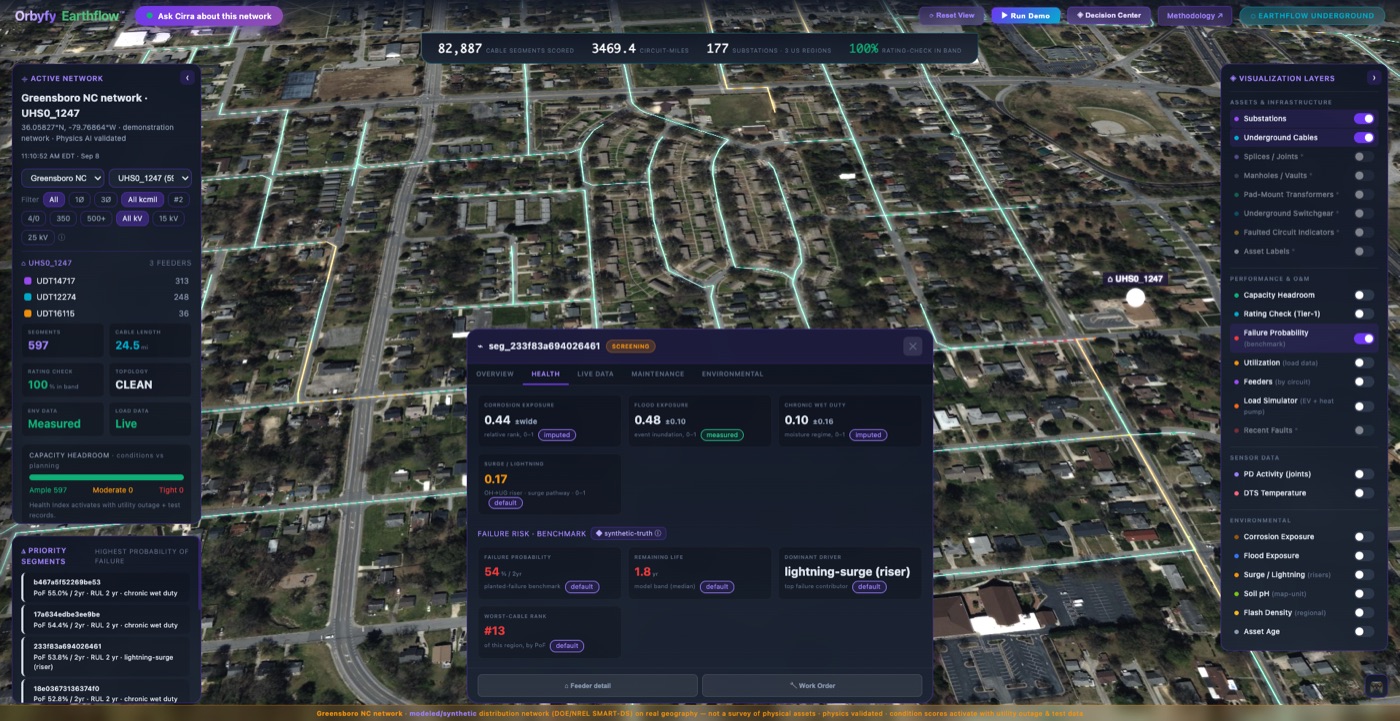
The fleet's entire failure risk, ordered — top of the list to bottom, every segment with its probability, its remaining life, and its reason.
Electrification lands on cable buried decades ago. See where headroom runs out — segment by segment, years ahead — and reinforce before the constraint arrives, not after it fails.
~1.1 million miles of underground distribution cable — and utilities cannot see any of it.
Replaced on age, not evidence — and an underground fault costs 3–4× an overhead one to restore.
Headroom judged on nameplate ratings — while electrification and new load keep arriving.
VLF, tan δ and sheath integrity all need the segment de-energized. Most utilities test a fraction and run the rest to failure.
+5,000–10,000 miles a year are going underground. The blind spot in the power grid is growing.
A cable does not fail because of itself. It fails on electrical and environmental conditions — together.
Cable condition is a complex electrical · thermal · chemical · mechanical problem, acting in combination — exactly what Physics AI is built for.
Physics builds each exposure per segment; your own outage history sets the weights.
- Corrosive soil attacks the lead sheath — moisture reaches the paper, and dielectric strength collapses.
- Water treeing — moisture under electrical stress grows trees through the insulation until breakdown.
Data outputs for every cable segment.
Earthflow powers granular geographic site intelligence — environmental perils on infrastructure. Acre by acre.
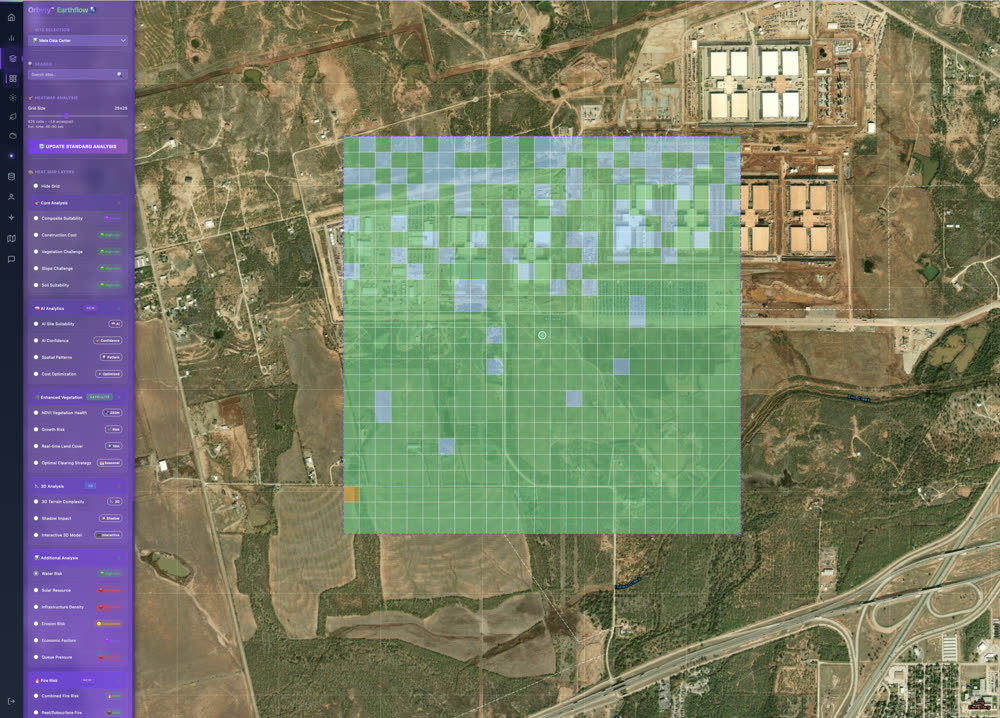
70+ data sources · 200+ KPIs per location · 1,100+ data points per lat/long · 1,300 sites · 1M+ acres analysed
- Asset registry · route & vintage
- Outage history · 5–10 yr, the ground truth
- Feeder loading · ≥1 yr, 15-minute
- Meter intervals · de-identified load shape
Underground
Physics AI
Engine
- Soil chemistry · 26
- Soil moisture · 44
- Flood exposure · 49
- Precipitation · 36
- Ground movement · 24
- Surface erosion · 60
Fused per segment — it resolves to your cable route, not a regional average.
Cable physics per segment — and every segment knows itself.
The training signal — 5–10 years of event-level records, the ground truth the weights are fitted to.
Where the cable actually runs — the geometry every physics exposure attaches to.
Feeder-head telemetry; meter intervals are the upgrade. The thermal and capacity driver.
Resolved per segment — Earthflow Physics AI: the ground, water and surface conditions along the route. Already run across hundreds of thousands of acres of distribution territory.
We have modeled the physics of failure of underground cable systems.
Weighed together into one score. The fitted layer is deliberately thin — and it is fitted to your failure history, nothing else.
The physics is fixed and cited. The only fitted layer is thin, and it is fitted to your utility's own failure history.
How does Earthflow Underground compare to incumbent modeling approaches?
Every model demo looks good. So we ran a head-to-head test. Earthflow Underground has been benchmarked against every publicly implementable alternative that exists today — two regulator methods, the academic peer-reviewed state of the art, and the age baseline. We lead all of them, across every dimension.
At the job that matters most: detecting the top-10% worst-ranked cables in the fleet.
We compared Earthflow Underground against four other ways to rank a cable fleet.
Blind head-to-head.
The coin flip that anchors the scale.
The ranking most utilities run on today.
Memorizes where failures happened — blind to first failures.
Survival curve on age — mathematically identical to an age rank.
Age exponential × duty & location lookups × condition modifiers. Run in default and a generous +evidence arm.
Peer-reviewed health index — eight parameters, fixed expert weights. The closest to us.
Physics-built exposures; the weights fitted to your own outcomes.
The gap between the field and Earthflow is precisely this axis: fixed weights vs weights fitted to outcomes.
We analyzed two distribution territories — segment by segment.
Real-pattern load profiles for one full year across both networks (DOE / NLR SMART-DS) — 15-minute profiles per feeder — establishing the year's duty profile.
A 10-year stress-tested simulated outage log — timestamps, cause codes, replacements — with its realism checked against 16 years of real UK (Ofgem) fault data and New Zealand's network disclosures.
Lightly loaded fleets — median duty 5–8% of planned rating — yet 500 segments run above 80% of rating, and 264 above 100%. This is the baseline every method was graded on, head to head.
Every model studied 8 years.
Then had to predict the next 2 years of potential failures.
Prediction date · Jan 1, 2017
graded blind
The 10-year outage log is not taken on faith — its realism is checked against 16 years of real UK (Ofgem) fault records and New Zealand's 29 networks.
Each model was asked for the top-10% worst cable list.
Then we scored performance.
Rank the fleet. Hand in your top-10% shortlist — and for every segment on it:
| Rank | PoF | RUL | Driver |
|---|---|---|---|
| #1 | 9.2% | 0–0.2 yr | lightning-riser |
| #2 | 8.7% | 0.3–1 yr | thermal |
| #3 | 7.9% | 0.5–1.4 yr | corrosion |
2017–18 plays out — ~250 segments actually fail per run. No model can react: every list is already frozen.
How many of the real failures landed on each model's list? Scored per model — 6 repetitions, 2 regions, identical protocol.
Same fleet, same data, same deadline — the only difference was the model.
76% of the cables that failed were already on Earthflow's top-10% list.
Earthflow captured 76% of all cables that went on to fail in the two years after the prediction date — across both territories, Greensboro NC and Austin TX.
135–200% better than CNAIM · ~70% better than Pattabi 2023
Earthflow in action — we output the 10 worst cables.
Nine of them failed in the next 2 years.
| Rank | Installed | Dominant driver — the “why” | Prior faults | PoF (2 yr) | RUL band | Outcome · 2017–18 |
|---|---|---|---|---|---|---|
| 1 | 1995 | Thermal stress | 422 | >99% | 0–0.2 yr | ✕ FAILED · Feb 2017 |
| 2 | 1981 | Thermal stress | 95 | >99% | 0.1–0.6 yr | ✕ FAILED · May 2017 |
| 3 | 2007 | Lightning-surge (riser) | 7 | 92% | 0.3–1.2 yr | ✕ FAILED · Sep 2017 |
| 4 | 1980 | Thermal stress | 18 | 85% | 0.3–1.5 yr | ✕ FAILED · Sep 2017 |
| 5 | 1991 | Lightning-surge (riser) | 22 | 75% | 0.5–2.0 yr | ✕ FAILED · Feb 2017 |
| 6 | 1987 | Lightning-surge (riser) | 9 | 75% | 0.5–2.0 yr | ✕ FAILED · Nov 2017 |
| 7 | 1986 | Lightning-surge (riser) | 4 | 71% | 0.5–2.2 yr | ✕ FAILED · Oct 2017 |
| 8 | 1996 | Thermal stress | 10 | 69% | 0.5–2.3 yr | ✕ FAILED · Apr 2017 |
| 9 | 2006 | Lightning-surge (riser) | 2 | 58% | 0.8–2.9 yr | ○ survived the window |
| 10 | 2009 | Thermal stress | 5 | 56% | 0.8–3.0 yr | ✕ FAILED · Nov 2017 |
Rank 1 failed inside its 0–0.2-year band — and rank 9, the one survivor, is shown, not hidden.
Then we took away the failure history.
We still correctly identified 6 out of 10 that failed.
In a real network, ~96% of cable segments have little or no fault history — so we ranked only the low-history fleet: ≤2 prior faults, 14,239 segments across both regions. This is the population a history-based method cannot see at all.
| Region | Installed | Dominant driver — the “why” | Prior faults | PoF (2 yr) | RUL band | Outcome · 2017–18 |
|---|---|---|---|---|---|---|
| Austin | 2014 | Lightning-surge (riser) | 2 | 81% | 1 yr (median) | ✕ FAILED |
| Greensboro | 2006 | Lightning-surge (riser) | 2 | 58% | 0.8–2.9 yr | ○ survived the window |
| Greensboro | 1982 | Chronic wet duty | 2 | 55% | 0.7–3.4 yr | ✕ FAILED · May 2017 |
| Greensboro | 1993 | Chronic wet duty | 2 | 54% | 0.8–3.4 yr | ✕ FAILED · Dec 2017 |
| Greensboro | 1999 | Lightning-surge (riser) | 2 | 53% | 0.8–3.6 yr | ✕ FAILED · Jan 2017 |
| Austin | 1978 | Thermal stress | 0 | 52% | 2 yr (median) | ○ survived the window |
| Greensboro | 2005 | Chronic wet duty | 2 | 48% | 1.0–3.8 yr | ○ survived the window |
| Austin | 1976 | Thermal stress | 0 | 48% | 2 yr (median) | ✕ FAILED |
| Austin | 1973 | Thermal stress | 0 | 44% | 2 yr (median) | ○ survived the window |
| Austin | 1987 | Thermal stress | 2 | 44% | 2 yr (median) | ✕ FAILED |
No failure precursors to lean on — ranked by physics alone, and six of the ten named in advance still failed within two years.
How steady is each model, run to run?
Earthflow is the steadiest in the field.
A model that isn't reliable between repetitions of the same test can't be reliable in planning — a method that wins on average but swings run-to-run is hard to plan capital against.
The top 5% — what a real annual budget can actually dig.
Earthflow's shortlist holds 3–4× the future failures of any incumbent.
When the budget only covers a handful of digs, this is the chart that matters: the digs you fund are the right digs.
What if reality doesn't follow our physics?
We rigged the test against Earthflow — it still wins by 60–80%.
If the arena secretly favored our math, these three tests would expose it. Each one plants a failure process built outside Earthflow's model family — same six seeds, identical protocol.
Failures planted with a different aging law than the one Earthflow assumes.
Every segment carries an invisible random frailty no model can see or compute.
Half the failure drivers made invisible to every model — Earthflow included.
Three failure processes deliberately built outside our model family — Earthflow leads every one.
The win is physics and outcomes, not a home-field artifact.
Then we broke the data.
Earthflow kept working.
Real utility data is imperfect — so we handicapped the inputs, one failure mode at a time, and re-ran the whole test. Earthflow is resilient in the face of bad data.
Even at its most degraded — no loading data, outages not even tied to segments —
Earthflow still beats the incumbent running on perfect data.
Could anyone get to 100%, a perfect prediction?
No — but +10% is still on the table.
Statistics guarantees a long tail: a fleet has thousands of genuinely low-risk segments, each carrying a small probability — and with that many of them, some inevitably fail. Those failures belong to segments whose true risk really was low; no better model, no more data, no added sensor could have put them on the list.
We measured the limit directly: ranking by the arena's true hazard itself — perfect knowledge — captures the same share Earthflow does. Earthflow already sits at the information ceiling. The gap to 100% is luck, not model error.
We tell you where the ceiling is — and exactly which sensor buys the next point.
Targeted sensing where the model says it pays, never blanket instrumentation.
Every cable segment outputs 50+ fields — and counting, every month.
Your parameters, your formats, your terms.
Adding or removing fields is configuration, not development.
Updated monthly — outages and load history accrue by the month, the environment moves by the season, and cable aging is slow physics; a faster refresh would re-rank on noise, not signal.
What we are — and what we are not.
Everything else is the Earthflow Underground Physics Engine.
- Not pre-trained on anyone's data — no utility data, no public datasets, no cross-utility bleed.
- Not training on your data — tuning seven parameters is not learning a model from your records.
- Not an LLM — no foundation model anywhere in the engine.
- Not sending your data anywhere — nothing leaves for a third party or another AI at inference.
- Not a fine-tune of someone else's model — nothing borrowed, nothing wrapped.
- Not a SaaS — we deliver answers, not another login.
- A Physics AI engine — constrained by governing equations, never free-fitted.
- First-principles physics — thermal, electrical, chemical, mechanical, hydrological — with cited constants; the statistical layer is the only fitted layer.
- Tuned per utility — seven parameters fitted to your outages; zero cross-utility anything.
- Built for imperfect data — degraded inputs widen the uncertainty band, never produce silent guesses.
- A data product — CSV · Parquet · GeoJSON · JSON API · rendered PDF/HTML — monthly, resolved per segment.
- Our own architecture — every module purpose-built, our custom code end to end.
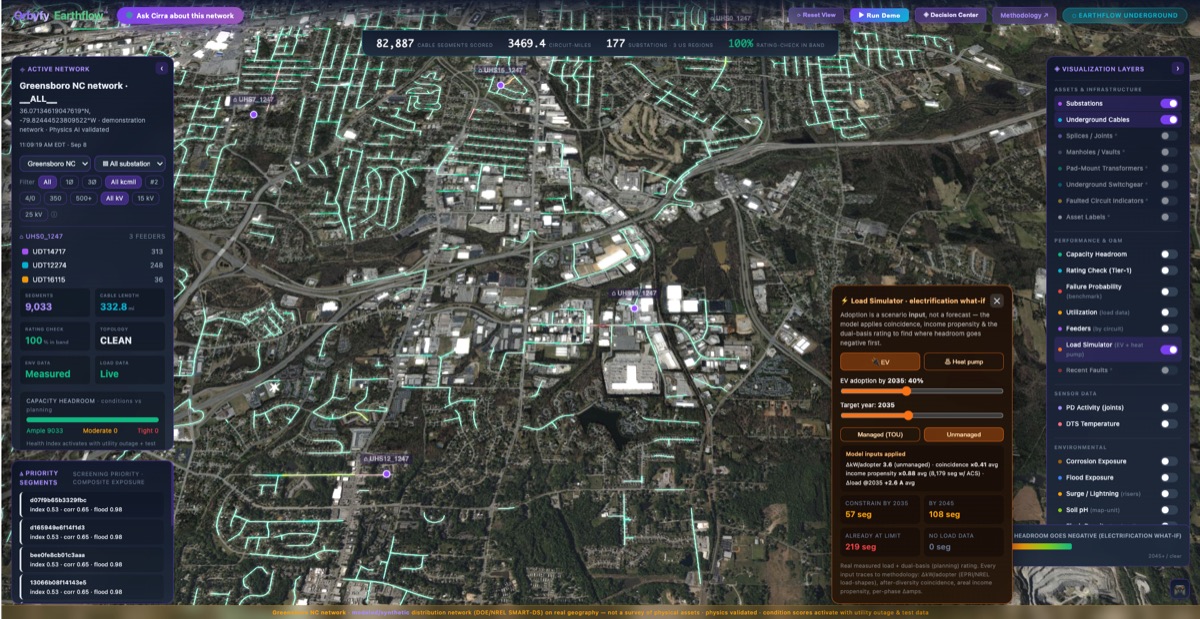
Built for the underground network utilities actually run.
* Work-order data is optional — it sharpens joint / splice localization and fault attribution, and activates the direct-splice covariate.
The Earthflow Underground model continues to refine and grow in complexity month over month — in progress.
The same four questions — now answered on every feeder segment.
Vintage, your outage history, thermal duty, soil corrosivity and flood exposure — with remaining useful life.
A thermal rating from soil properties and burial method, against your measured loading.
The worst-segment list your partial-discharge and tan δ crews work from.
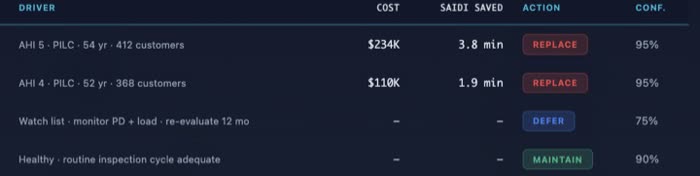
Corridors ranked by risk reduction per mile of spend.

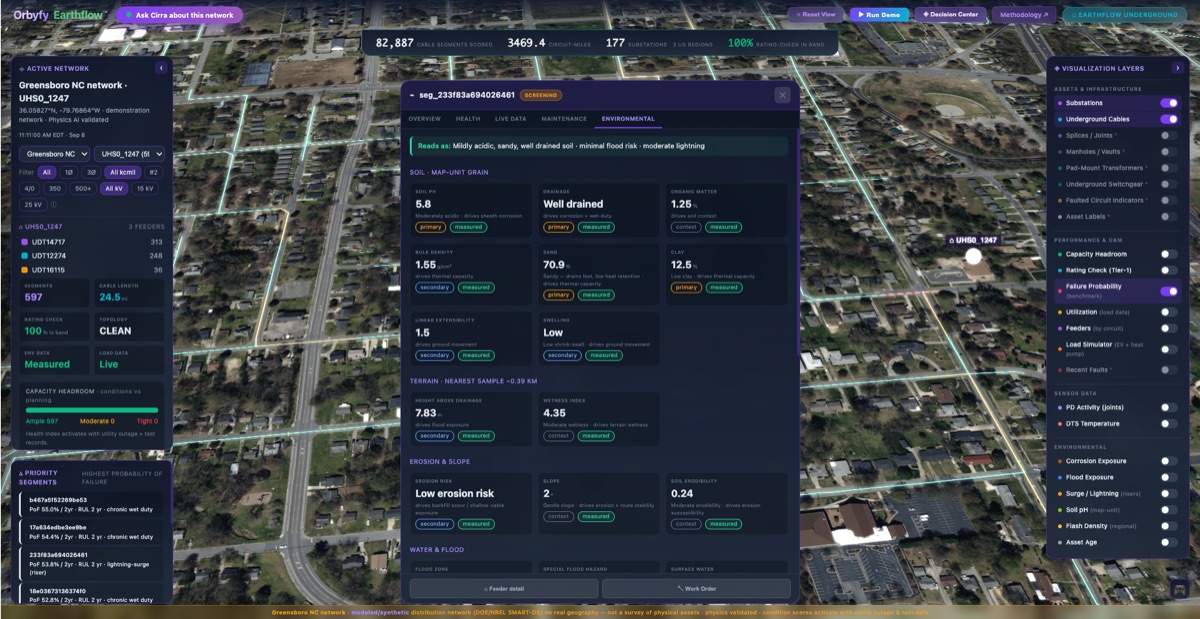
Produced by the Earthflow underground physics module family. Every score carries a value, a confidence interval and its provenance — each input tagged measured or imputed, so a number can be defended rather than just quoted.
Up to 10 years of deferred capital, and up to 10% off underground O&M (modelled)
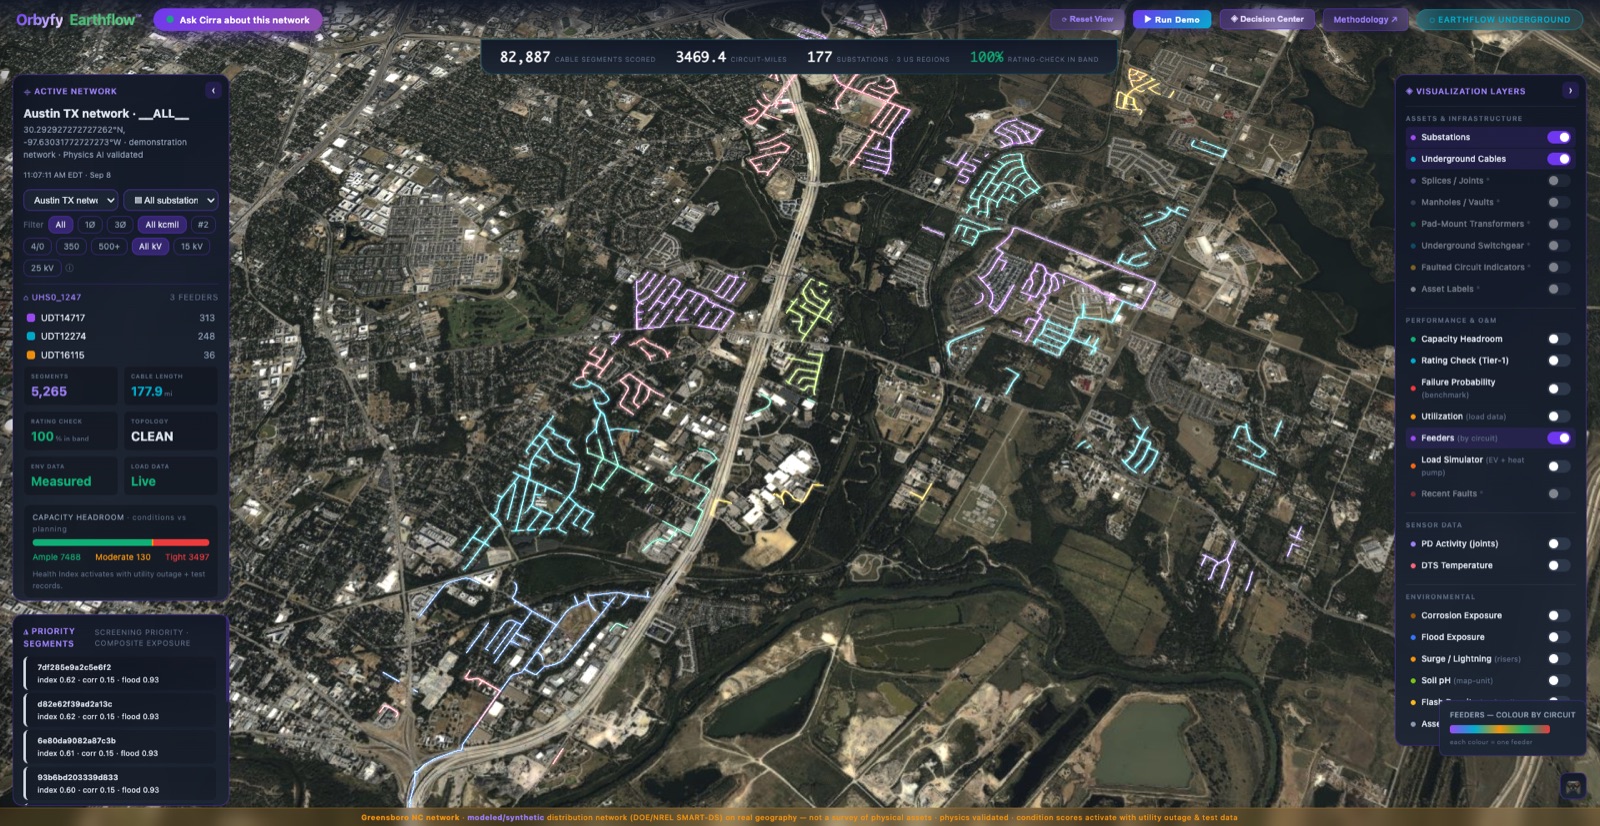
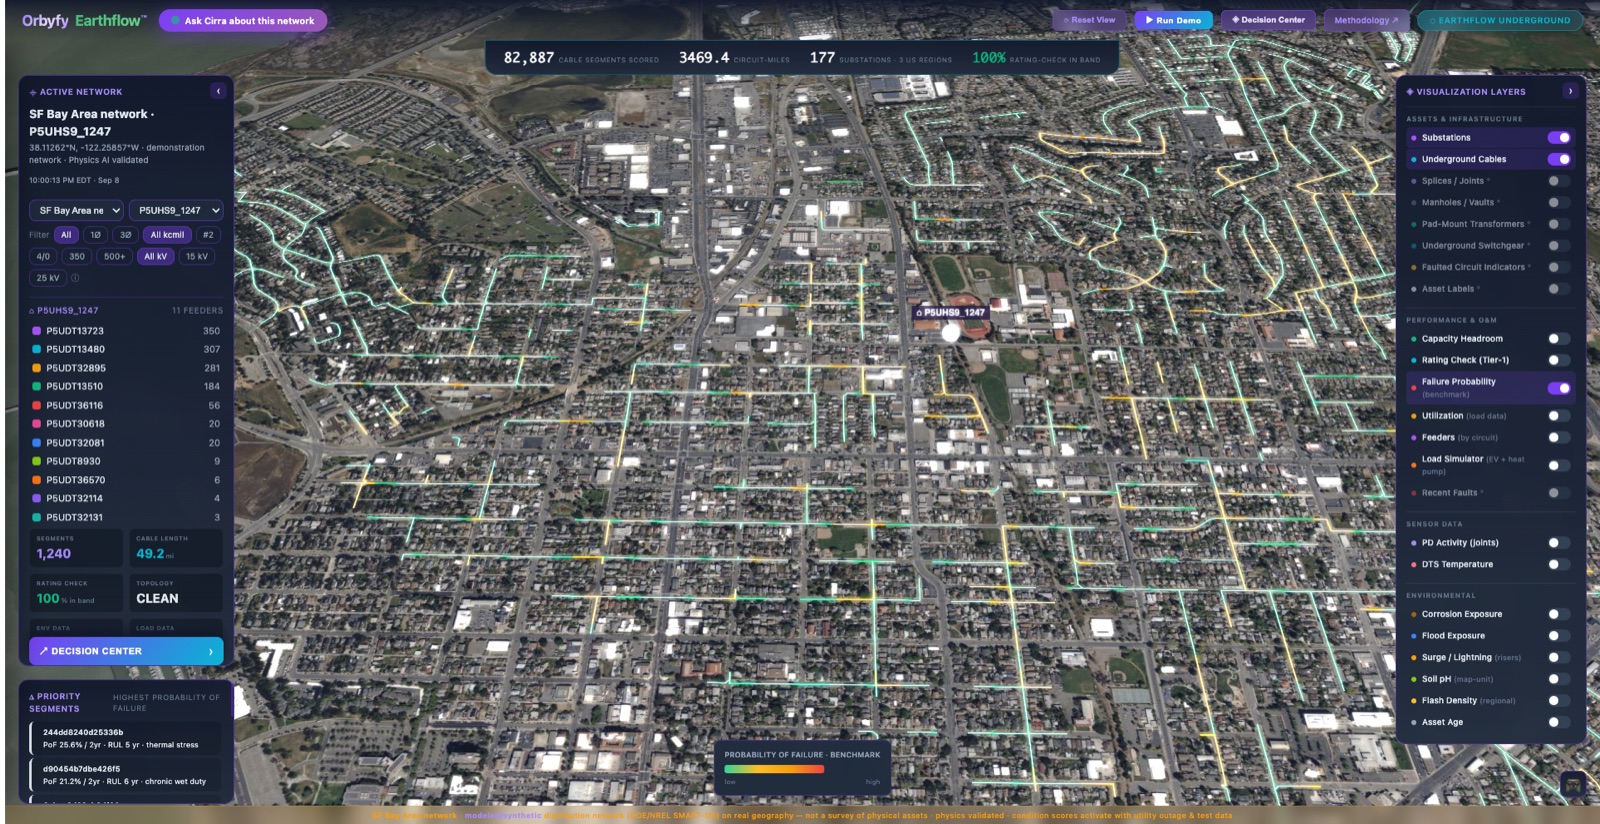
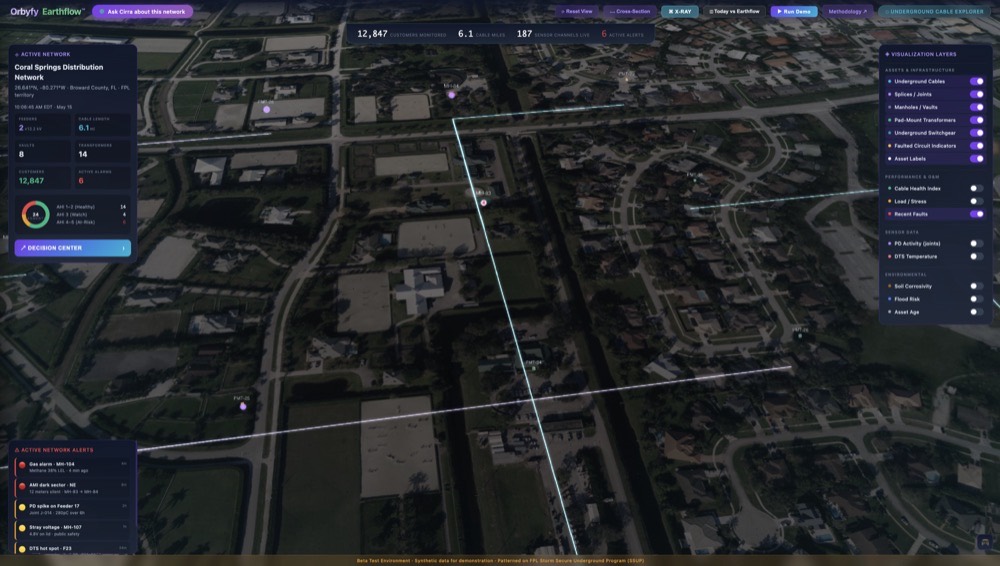
A living twin — all live in this demo.
📍 Greensboro NC · 📍 Austin TX · 📍 San Francisco CA
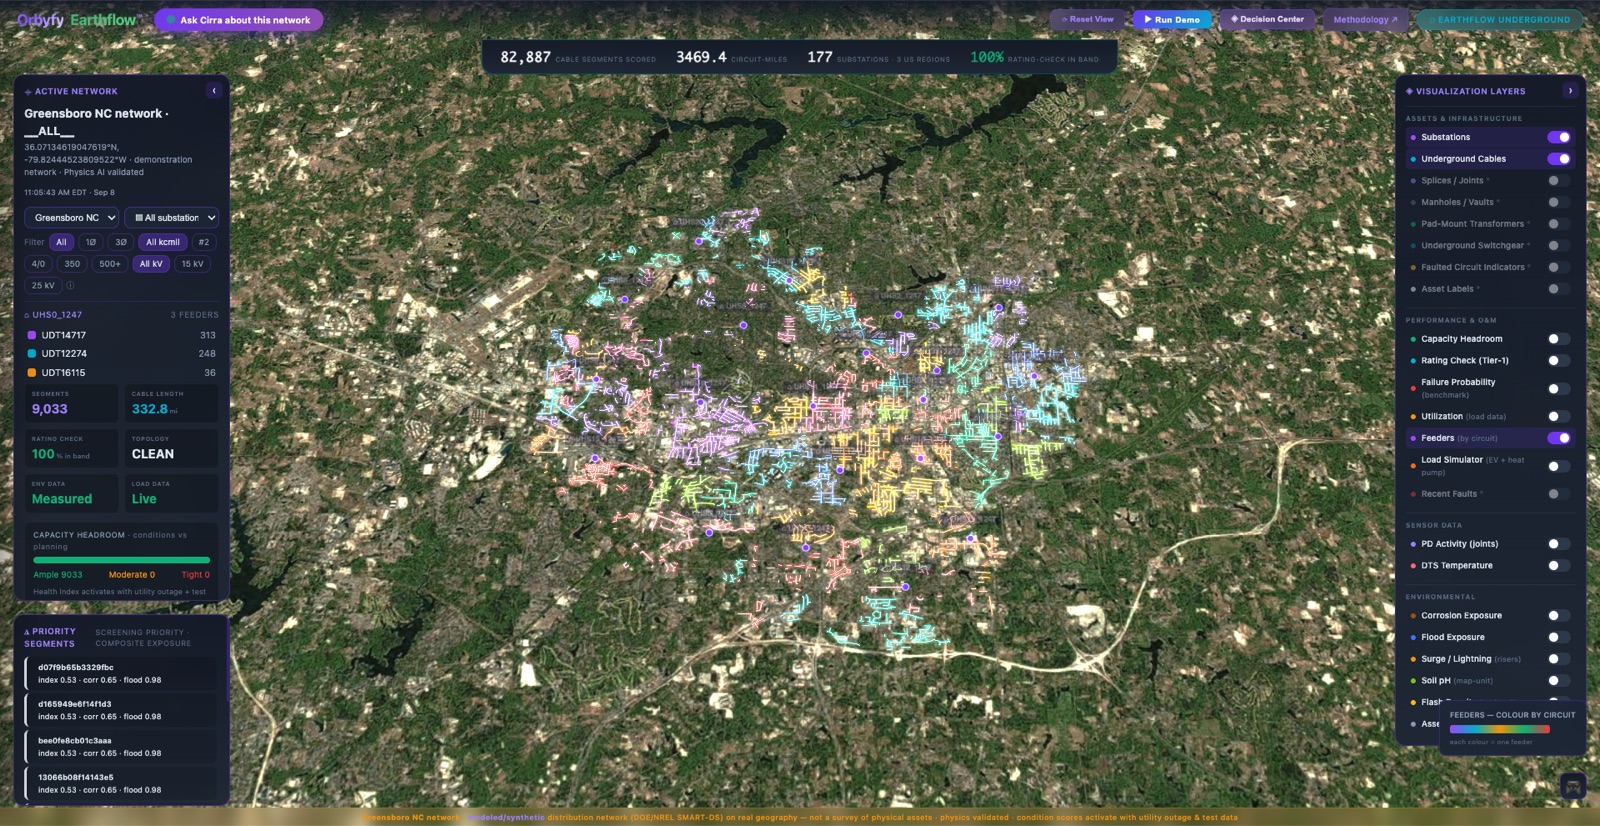
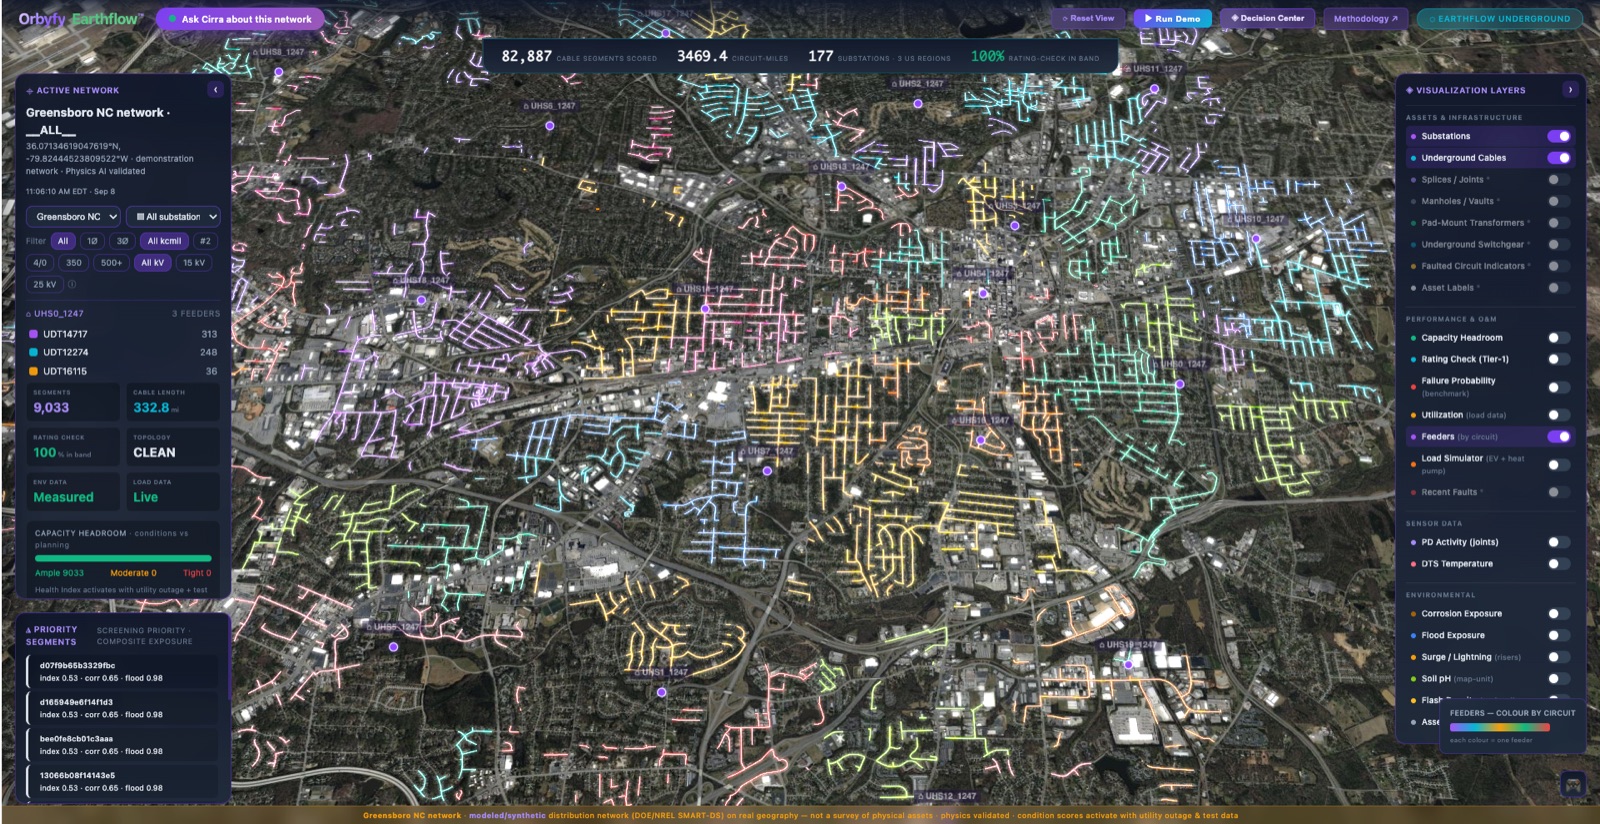
Every segment scored, every score auditable. Live product capture on modeled networks — click any segment for its index, its confidence band, and the inputs behind it, measured or imputed.
Open the live explorer →Start with four extracts.
We do the rest.
- The four extracts · registry, outages, loading, meter intervals
- Read-only, one-way, no operational-technology link
- Soil · chemistry & corrosivity
- Water · flood & groundwater
- Moisture, terrain · surge exposure
- 100% national coverage, resolved to the segment
Benchmarked blind against every publicly implementable alternative — 76% of failures captured, 9 of the top 10 named in advance.
earthflow.orbyfy.com/earthflow-underground · earthflow.orbyfy.com/underground-epri (slide deck) · Orbyfy, Inc.